California Home Sales Fell to a Nearly Three-Year Low in October 2026: 246,830 Sales, an $886,760 Median, and What the County Numbers Mean for Buyers and Sellers

California home sales fell in October to their lowest level in nearly three years. Existing single-family homes sold at a seasonally adjusted annual rate of 246,830, down 5.2% from September and 12.7% from October 2025, the California Association of Realtors reported on November 17, 2026. The statewide median price was $886,760, down 1.4% on the month and essentially unchanged from a year earlier, which ends five straight months of annual gains. Sales fell in all five regions and in 44 of 52 counties. Prices held because the buyers who left were mostly in the middle of the market, not because demand is strong.
What did the October report show?
Sales: 246,830 annualized, the 49th straight month under 300,000, and the largest annual decline since September 2023. Year-to-date sales are now 0.6% below 2025.
Price: $886,760 median, against $899,720 in September and $887,330 a year ago. The price per square foot was $434, up 0.7% from a year earlier.
Rates: the 30-year fixed averaged 7.33% in October, up from 6.86% in September and 6.25% a year ago, which C.A.R. calls the third-highest monthly average in 26 years.
Supply: the Unsold Inventory Index rose to 3.8 months from 3.7 in September and 3.2 a year ago. Active listings fell 1.4% from September but are 6.6% above last October.
Speed and negotiation: the median home sold in 29 days, down from 32 a year ago, at 98.5% of its list price, against 98.3% a year ago.
C.A.R.'s infographic for the report is below (California Association of Realtors, October 2026 Sales and Price Report).
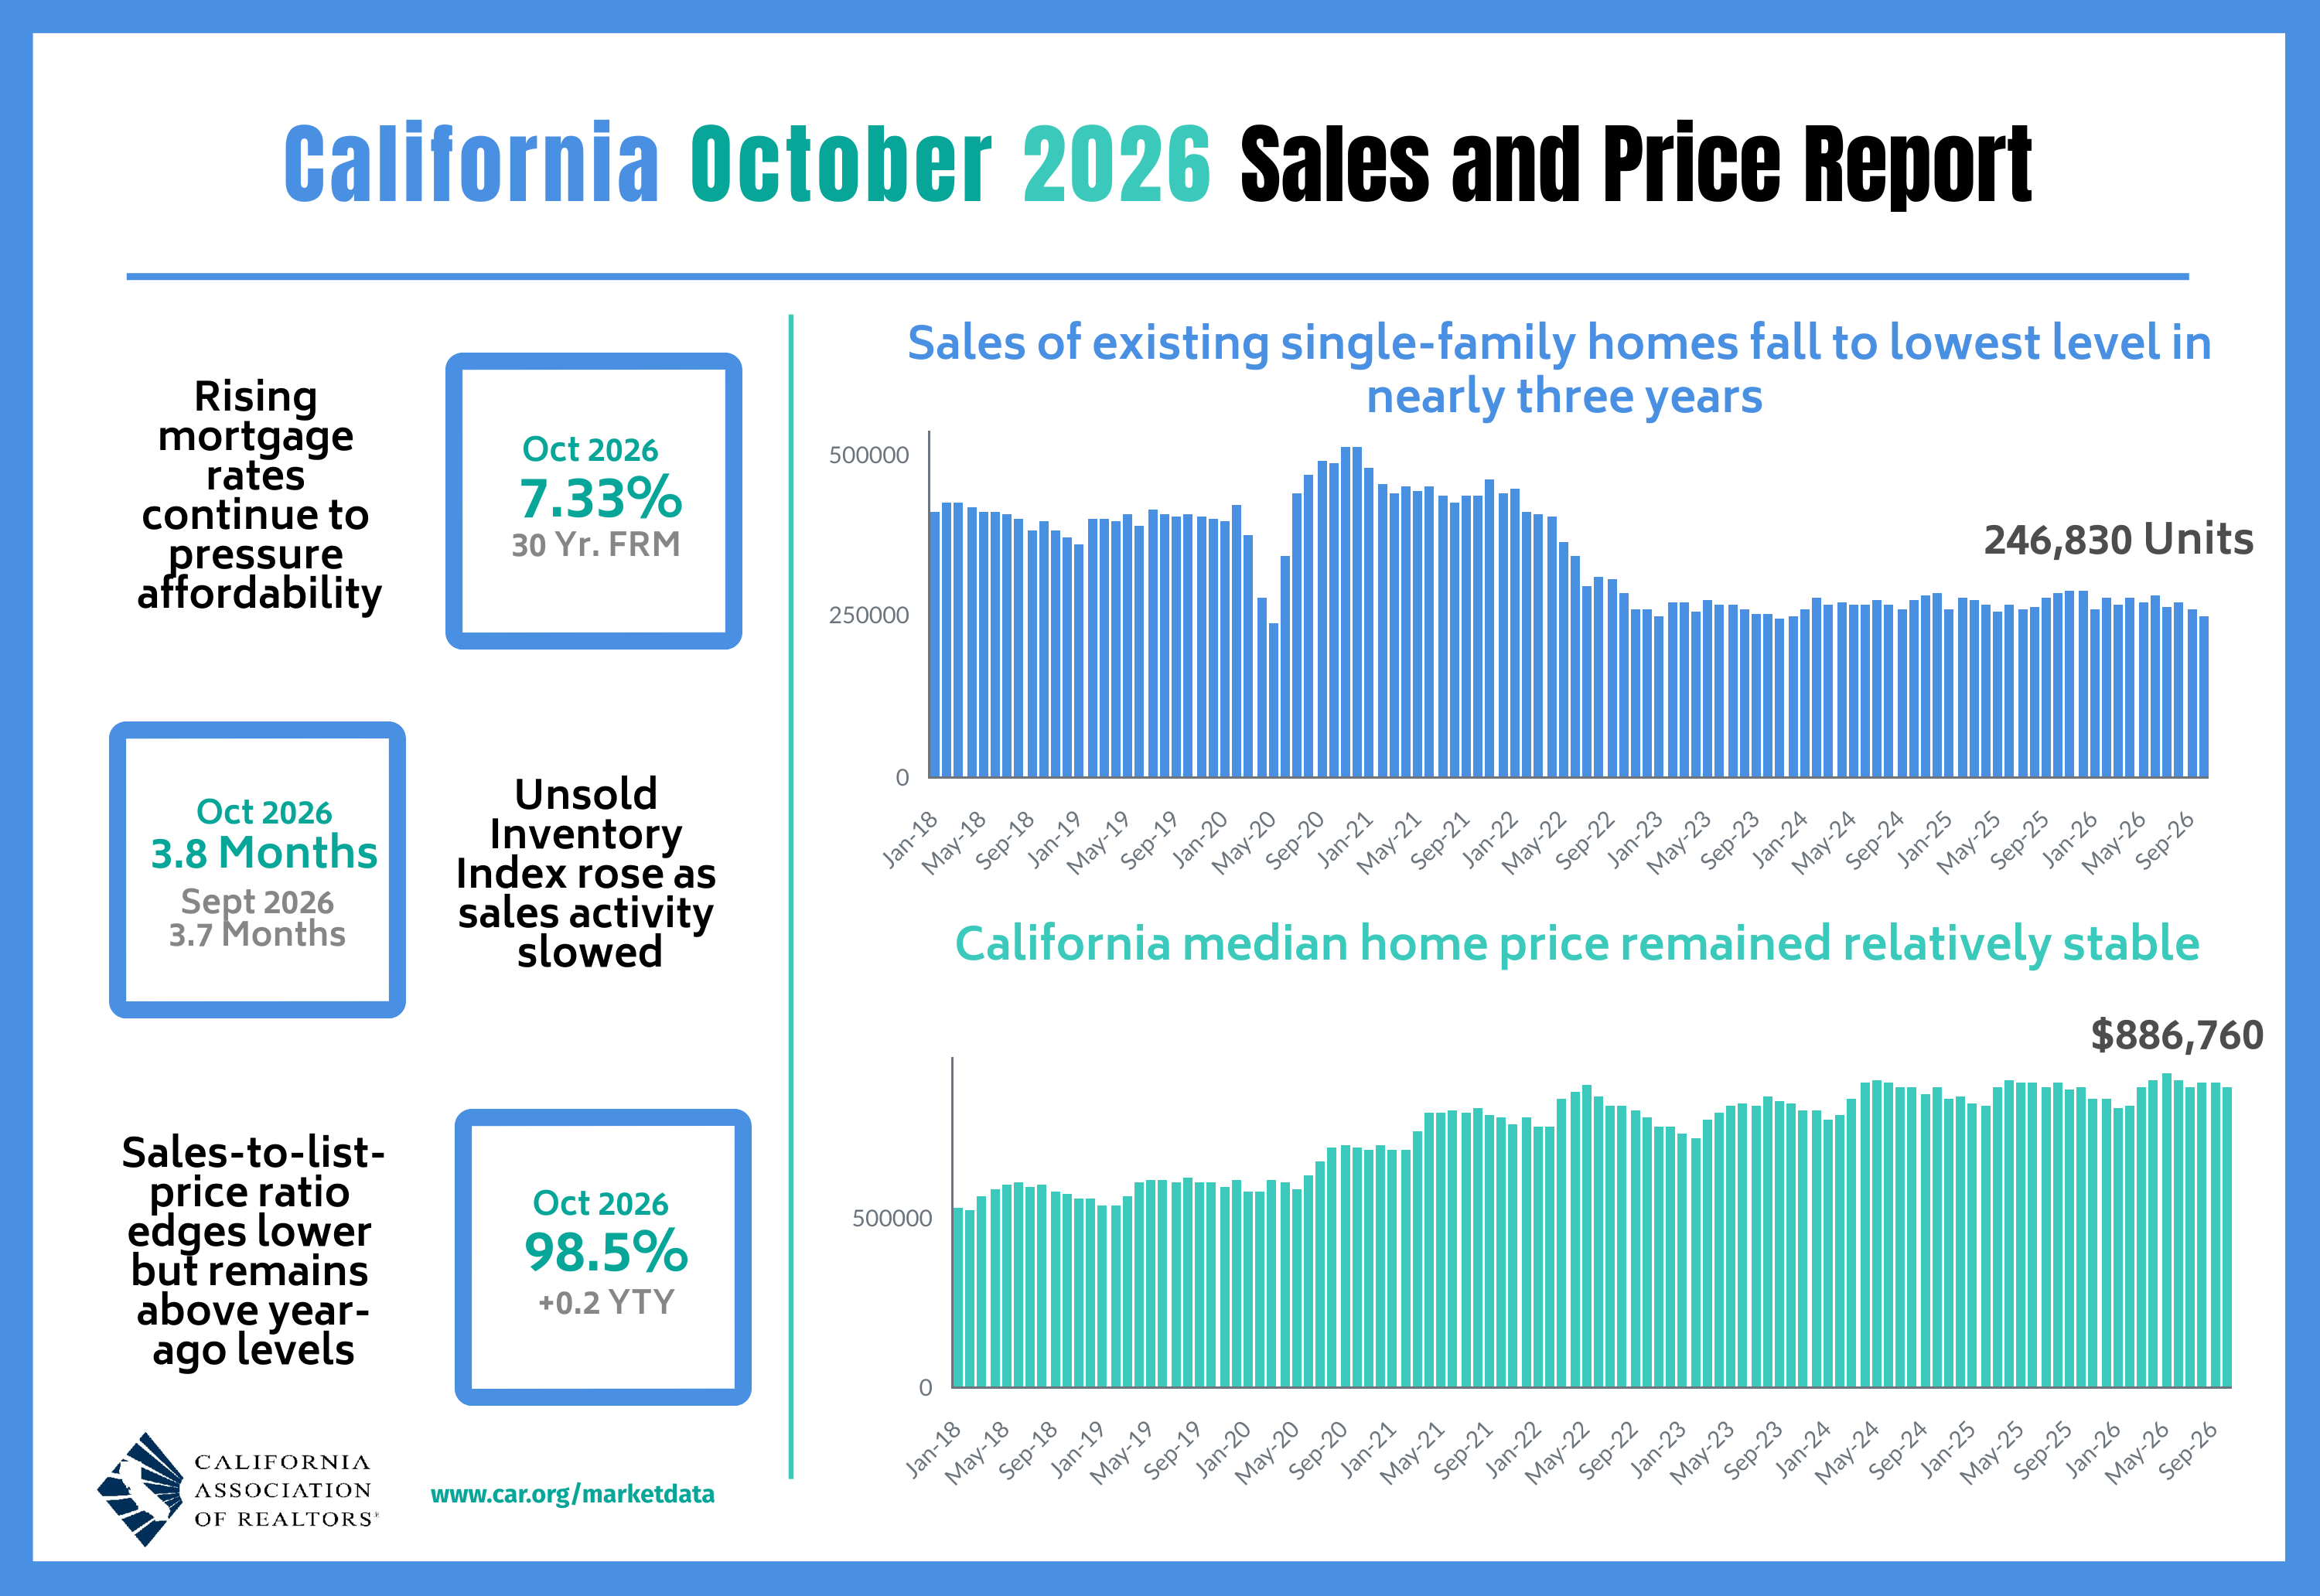
C.A.R.'s president, Mark Peterson, tied the drop to the rate spike: "When mortgage rates jumped to a nearly three-year high in late September, we saw many buyers step back and reassess what they could afford, which led to fewer closed sales in October." Chief Economist Jordan Levine said sales "will likely remain soft in the near term, but pent-up demand continues to build as many prospective buyers stay on the sidelines."
Why are prices flat when sales are down 13%?
Because of who is still buying. Sales fell by double digits in six of the seven price bands C.A.R. tracks. The steepest drops were between $750,000 and $999,999 (down 20.7%) and between $1 million and $1.99 million (down 19.7%); the $500,000-to-$749,999 band, nearly a quarter of all sales, fell 16.2%. Only homes at $2 million and above sold more than a year ago, up 0.7%. Homes at $1 million and above made up 35.9% of sales, against 35.0% a year earlier, and that mix holds the median up.
The same thing shows in supply. Listings are not flooding in; they are sitting longer. C.A.R. notes that months of supply rose while active listings fell on the month, which "suggests that weaker sales activity was the primary contributing factor." The national picture matches: NAR's October existing-home sales were the lowest since 2010, as Properkey's report on the national numbers covers.
Which regions and counties fell the most?
Southern California led, with sales down 18.9% from a year ago and its median price down 0.6% to $870,000. The Central Valley fell 14.9%, the Far North 14.8% and the San Francisco Bay Area 12.1%; the Central Coast slipped 4.6%. The Bay Area was the only region where sales rose from September (up 1.9%) and its median rose 5.8% from a year ago to $1,375,000. Months of supply run from 2.4 in the Bay Area to 4.1 in Southern California and 5.6 in the Far North.
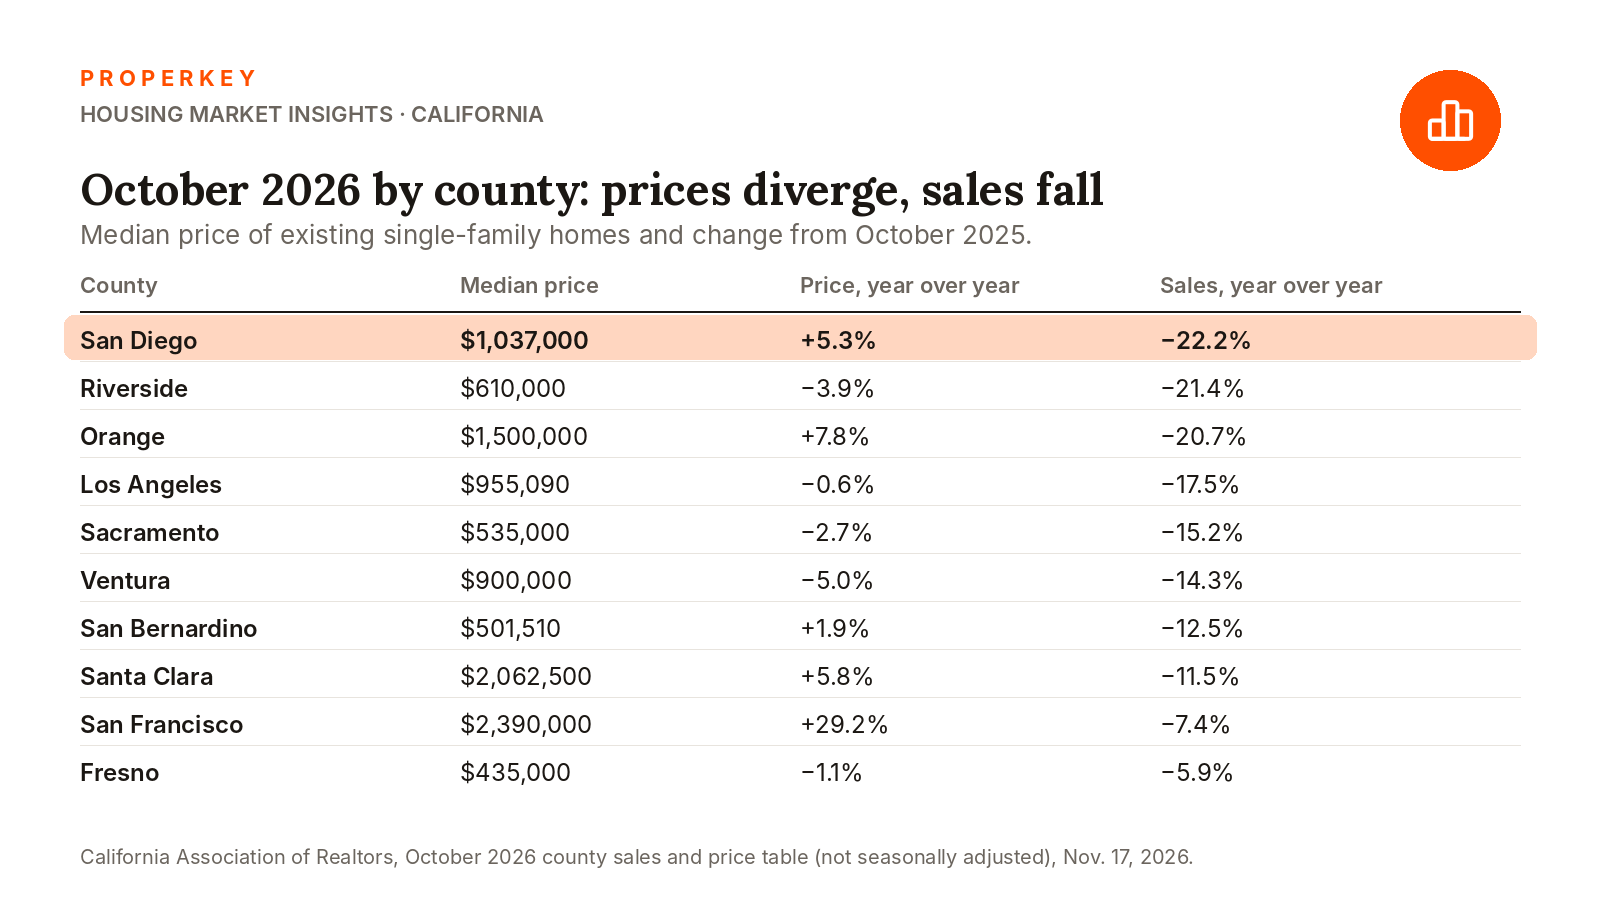
By county, sales were down 22.2% in San Diego, 21.4% in Riverside, 20.7% in Orange, 17.5% in Los Angeles, 15.2% in Sacramento and 12.5% in San Bernardino. Prices diverged: San Diego's median was $1,037,000, up 5.3% from a year ago, and Orange County's $1,500,000, up 7.8%, while Los Angeles ($955,090, down 0.6%), Riverside ($610,000, down 3.9%), Ventura ($900,000, down 5.0%) and Sacramento ($535,000, down 2.7%) were lower. San Francisco was the outlier, with its median up 29.2% to $2,390,000 on thin, high-end volume.
What does it mean if you are selling?
There are about one-eighth fewer buyers than a year ago, and they are closing at 98.5% of list price. A home priced where the last comparable sale closed in the spring is priced for a market that had more buyers. Builders are competing for the same people: 46% cut prices in November, as Properkey's piece on builder incentives explains. The sellers who are getting to closing are pricing to current comparables, expecting an offer that asks for a credit toward closing costs or a rate buydown, and keeping their own costs down. Properkey lists homes for a $0 listing fee with full MLS exposure, professional photos and a 3D tour.
What does it mean if you are buying?
You have room to negotiate and time to inspect, and the price is not the part that got cheaper. Freddie Mac's weekly average rate was 7.11% on November 12, and daily lender quotes rose to about 7.5% by November 16. Get a quote the day you write an offer; Properkey's finance desk shops the lenders on one application. Use the contingency periods: Properkey's guides to the inspection contingency and to a low appraisal explain how. Whether to wait is a separate question; see buy now or wait until 2027. Start a search at properkey.us/find.
Questions people ask
How many homes sold in California in October 2026? Existing single-family homes sold at a seasonally adjusted annual rate of 246,830, down 5.2% from September and 12.7% from October 2025, the lowest in nearly three years, according to C.A.R.
What is the median home price in California? $886,760 in October 2026, down 1.4% from September and essentially unchanged from $887,330 a year earlier.
Are California home prices falling? Statewide they are flat year over year. They are lower than a year ago in Los Angeles, Riverside, Ventura and Sacramento counties and higher in San Diego, Orange, Santa Clara and San Francisco. Sales volume, not price, is what has dropped.
How long does it take to sell a house in California now? The median was 29 days in October 2026, and homes sold for 98.5% of list price. Unsold inventory stood at 3.8 months of supply.
This article reports C.A.R.'s data for general information and is not financial advice. County figures are not seasonally adjusted, and a median price reflects the mix of homes sold, not the value of any one home.
Sources: C.A.R. October 2026 home sales and price report (Nov. 17, 2026); C.A.R. October 2026 Sales and Price infographic; Freddie Mac PMMS; Mortgage News Daily.
Written by Keyro, Properkey's AI. Properkey, DRE #01979718.