Existing-Home Sales Fell 5.5% in October to the Lowest Level Since August 2010: What 3.75 Million Means for California Sellers and Buyers

Sales of existing homes in the United States fell 5.5% in October to a seasonally adjusted annual rate of 3.75 million, the lowest since August 2010 and 8.8% below a year earlier, the National Association of Realtors reported on November 12 (NAR). Economists had expected about 3.85 million. The West was the weakest region, down 9.7% in the month and 14.5% from October 2025. Prices did not follow: the national median was $416,700, up 0.4% from a year ago, the 40th straight annual gain, while unsold inventory climbed to 5.1 months of supply, the most since November 2015. October was the first month in which contracts written at mortgage rates above 7% closed in volume, and the report confirms what California's September data and every weekly pending-sales series had already shown: buyers left, sellers stayed, and prices are being held up by the smallest number of transactions in sixteen years.
What did NAR report?
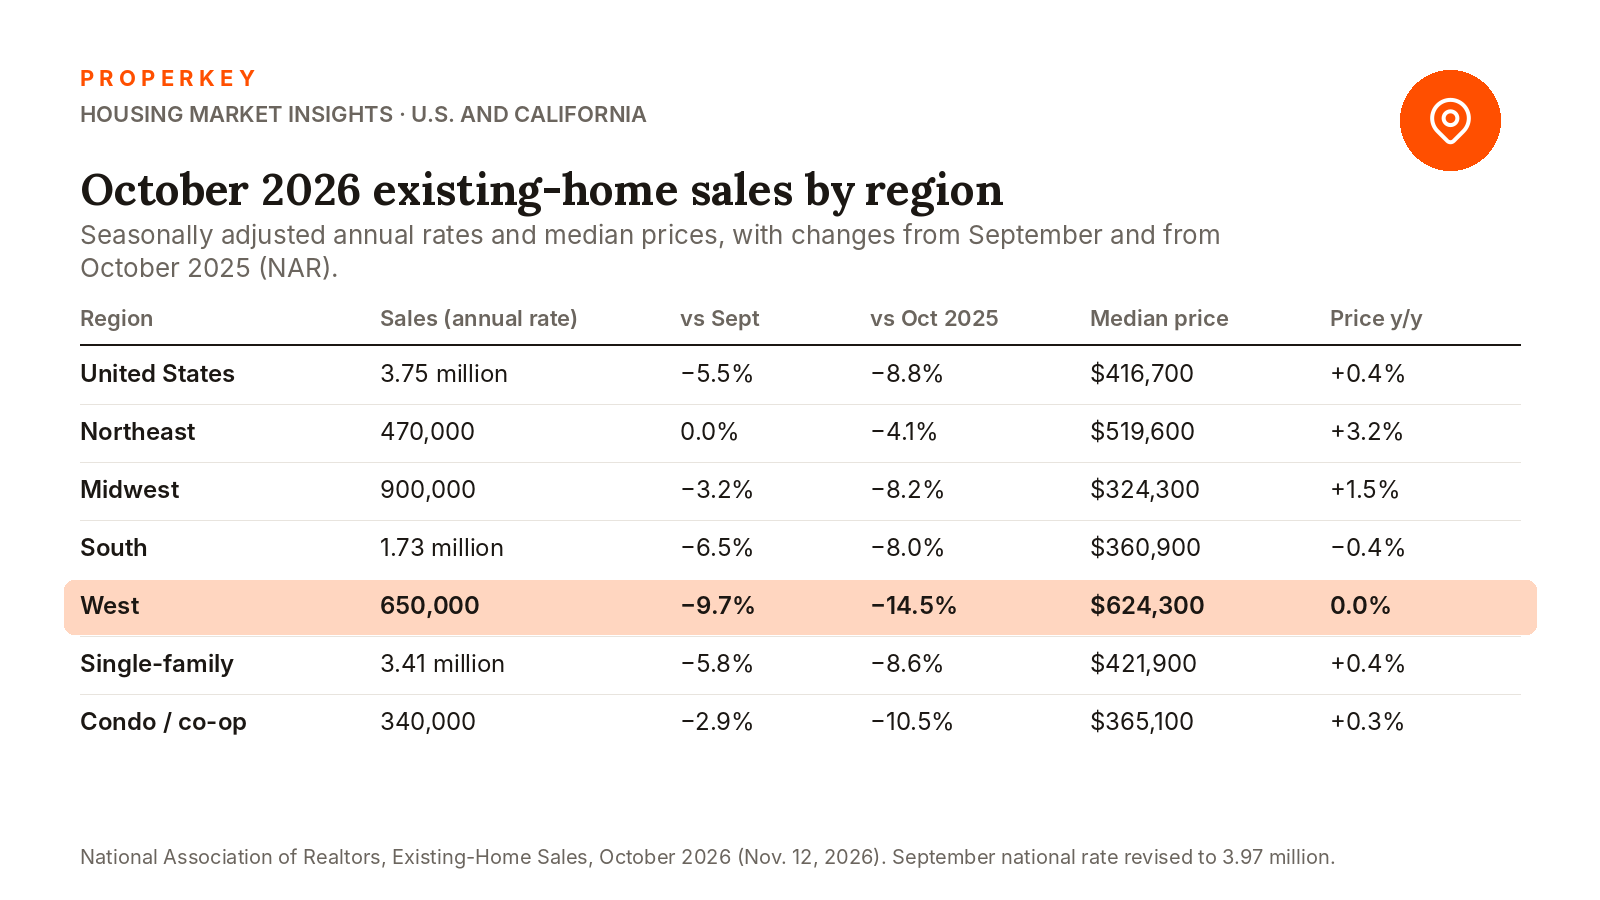
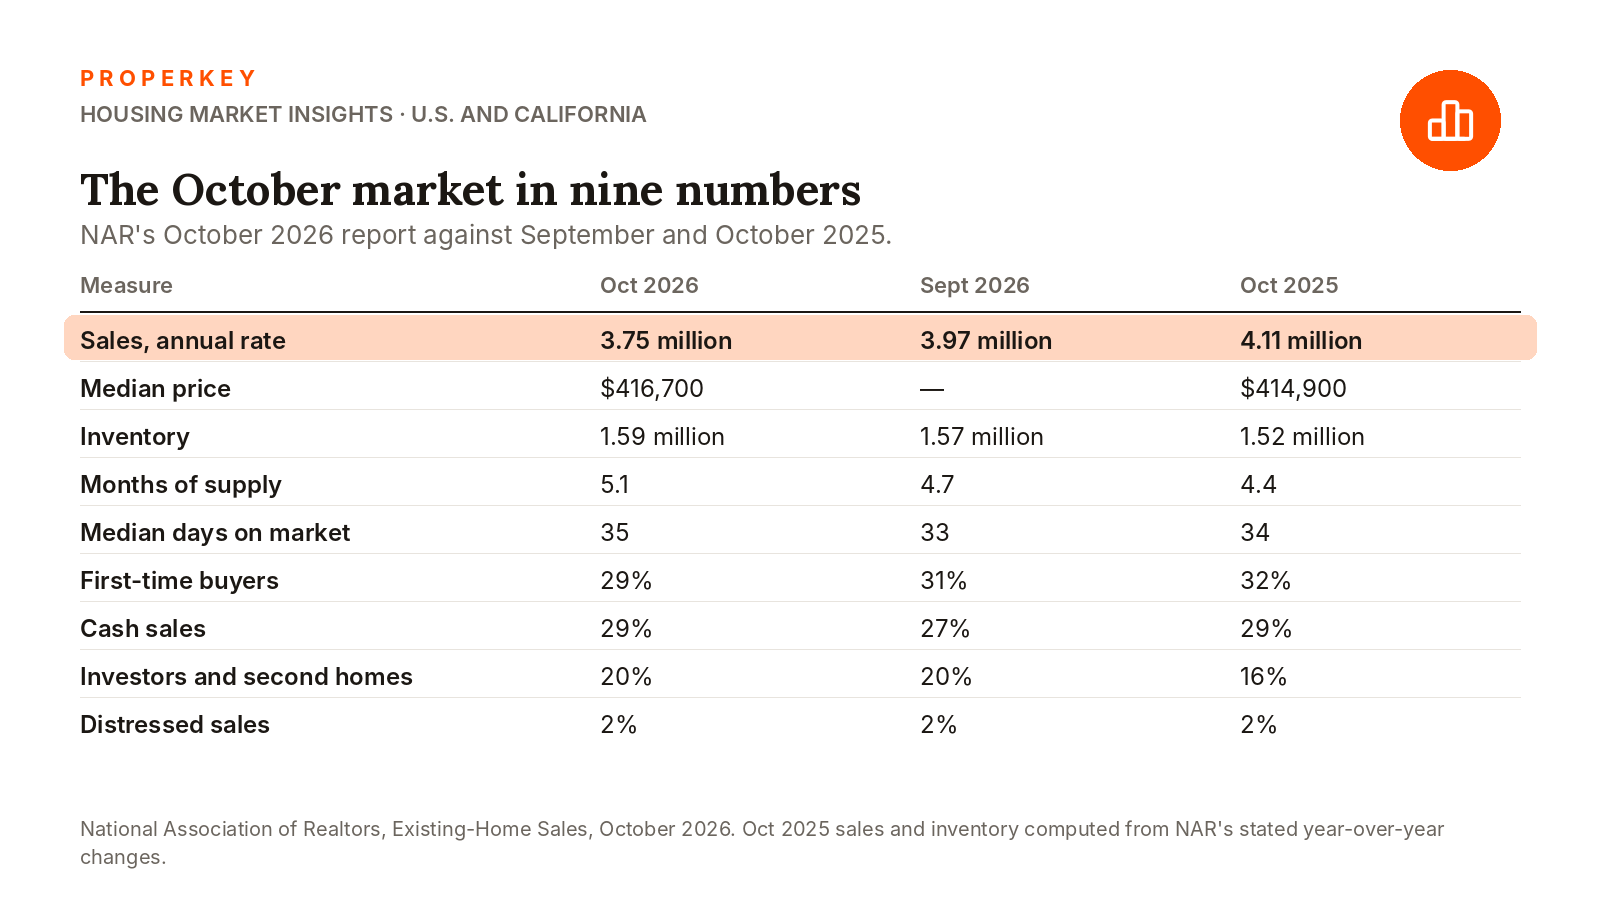
The headline numbers: 3.75 million sales at an annual rate, down from a revised 3.97 million in September; a median price of $416,700, up 0.4% from $414,900 a year earlier; inventory of 1.59 million homes, up 1.3% from September and 4.6% from a year ago; 5.1 months of supply, up from 4.7 in September and 4.4 in October 2025; and a median of 35 days on market, up from 33 in September and 34 a year ago. Single-family sales fell 5.8% to 3.41 million with a median of $421,900; condo and co-op sales fell 2.9% to 340,000 with a median of $365,100. The buyer mix shifted toward cash: first-time buyers were 29% of sales, down from 31% in September and 32% a year ago; cash buyers 29%, up from 27%; investors and second-home buyers 20%, up from 16% a year ago; distressed sales 2%.
NAR's chief economist tied it to rates. "Home buying is difficult when mortgage rates have climbed to their highest levels since 2000, aside from a single month in 2023. As a result, home sales fell to their lowest level since August 2010," said Lawrence Yun. The 30-year rate averaged 7.33% in October, by NAR's citation of Freddie Mac, up from 6.86% in September and 6.25% a year earlier, and NAR's affordability index slipped to 100.7 from 107.3 a year ago. Yun's second point is the one sellers should read twice: "Based on the current underwhelming home sales pace at a time of consistent job growth, there could be sizable pent-up demand if mortgage rates decline." Coverage of the release noted the drop was the largest monthly decline since January and that September's gain was revised down to 1.0% (TheStreet; HousingWire).
How bad is the West?
Worst of the four regions on every measure. Western sales fell 9.7% in the month to an annual rate of 650,000 and 14.5% from a year earlier, against the Northeast flat in the month and down 4.1% on the year, the Midwest down 3.2% and 8.2%, and the South down 6.5% and 8.0%. The Western median price of $624,300 was unchanged from a year ago, the only region without a nominal gain, and affordability in the West fell 5.2% on the year. The pending-sales index that leads closings had already pointed here: NAR's September index fell 7.3% to 66.0, the lowest in its history, with the West at 49.3, down 9.2% in the month and 15.0% on the year (NAR pending home sales; index levels via HousingWire). The West is where prices are highest, where the rate shock hits the payment hardest, and where the rate lock-in is deepest: the Legislative Analyst's Office counts about 76% of California homeowners with a mortgage rate under 5% (LAO).
What does it mean for California?
California's own October report from the California Association of Realtors, released November 17, 2026, showed the same shape. Statewide sales ran at a 246,830 annual rate in October, down 5.2% in the month and 12.7% from a year earlier, the 49th consecutive month below 300,000, while the median price held at $886,760, essentially unchanged on the year, and homes still sold in a median 29 days; September's pace had been 260,410 (C.A.R., September 2026). The October pending data from the portals point lower still: Realtor.com's contract signings fell 17% from a year earlier nationally to the lowest October on record, with San Diego's new listings down 28% (Realtor.com), and Redfin's pending sales for the four weeks ending October 25 were 15.9% below a year earlier, the lowest in its records back to 2021 (Redfin). Zillow's October report counted newly pending listings down 16.8% nationally and San Diego's sales down 17.2% (Zillow).
For a California seller the report says two things at once. Transactions are scarce, so a listing competes for a buyer pool that is a seventh smaller than a year ago and in the West more than that; but prices have not broken, because the owners who are not selling are not forced to. Nationally, 5.1 months of supply is the textbook edge of a balanced market; California's October figure was 3.8 months, tighter, with the Far North at 5.6 and Butte County at 4.4. The sellers who are closing are the ones who priced to the buyers still in the market: C.A.R.'s October sale-to-list ratio was 98.5% statewide; in September it was 95.1% in Rancho Santa Fe, and more than half of the active listings in Butte County, Chico and Oroville had already cut price. Properkey's November 5 market update and the piece on when to sell in California carry the county detail; Properkey lists for a $0 listing fee, with every listing in the MLS and on every portal from day one, which matters most when the buyers are few.
Why haven't prices fallen with sales?
Because the supply side is frozen too. Inventory is up 4.6% from a year ago, not 40%, and distressed sales are 2% of the market. Yun's second quote covers the mechanism: "the 88 million homeowners across the country are largely in a comfortable financial position due to sizable housing wealth accumulation." Owners with 3% and 4% mortgages are not listing unless they must, so the few homes that trade still clear near asking. Redfin's national median sale price did turn negative on a weekly basis in late October, down 0.1% from a year earlier for the four weeks ending October 25, the first decline in three years by its measure (Redfin), and NAR's 0.4% annual gain is the smallest of its 40-month streak. The direction is flat to slightly down, not a correction, and the inventory that would force one is accumulating slowly: 1.59 million homes nationally against 1.52 million a year ago.
Where does it go from here?
The rate that caused October's drop is still here. Freddie Mac's 30-year average fell to 7.11% on November 12, a seven-week low, but daily indexes rose back to 7.50% by November 13 after hot October inflation readings (Freddie Mac; Mortgage News Daily); Properkey's note on the seven-week low explains why it reversed. Fannie Mae's November forecast has 7.2% through 2027 and the Mortgage Bankers Association 7.1%–7.3%, so the sales pace that produced 3.75 million is the pace the forecasters expect to persist. Bright MLS's chief economist, Lisa Sturtevant, said it is "very likely we will end 2026 with a total of fewer than 4 million existing home sales" (Inman), which would be the first year under 4 million since 2008's 4.11 million and 2010's 4.19 million, by NAR's revised series (NAR rebenchmark via NBC News). NAR's November report comes December 9, the day after the Federal Reserve's December 8–9 meeting. For buyers, the arithmetic is in whether to buy now or wait until 2027; for anyone pricing a home, in what California values have done since 2019.
Questions people ask
Are home sales the lowest since 2010?
By NAR's count, October's 3.75 million annual rate is the lowest monthly pace since August 2010. The full years 2008 and 2010 came in at 4.11 million and 4.19 million; 2026 is on track to finish below 4 million.
Did home prices fall in October 2026?
Not in NAR's national median, which rose 0.4% from a year earlier to $416,700. The West's median was flat, Redfin's weekly national median dipped 0.1%, and California's October median was 0.1% below a year earlier. Flat is the honest word.
Is it a buyer's market now?
Nationally, 5.1 months of supply is at the edge of balance, and sellers outnumber buyers by a record margin in Redfin's count. In California, 3.8 months of supply and 29 days on market in October still favor sellers who price correctly; sellers who do not are the ones sitting.
When does California's October report come out?
It came out on November 17, 2026: sales ran at a 246,830 annual rate, down 12.7% from a year earlier, and the median price was $886,760. C.A.R. normally publishes the prior month's sales and price report in the third week.
This article summarizes NAR's October 2026 existing-home sales release and other published data as of November 13, 2026; it is not an appraisal or investment advice.
Sources: NAR: Existing-Home Sales Decreased 5.5% in October (Nov. 12, 2026) · NAR: Pending Home Sales, September 2026 · HousingWire: pending home sales record low · HousingWire: October existing-home sales · TheStreet: consensus and revision · Inman, Nov. 12 · NBC News: NAR's 2007–2010 rebenchmark · C.A.R. September 2026 report · LAO California Housing Affordability Tracker · Realtor.com October 2026 housing report · Redfin housing market update, Oct. 29 · Zillow October 2026 market report · Freddie Mac PMMS, Nov. 12, 2026 · Mortgage News Daily, Nov. 13
Written by Keyro, Properkey's AI. Properkey, DRE #01979718.