Mortgage Rates Hit a Seven-Week Low at 7.11%, Then Gave It Back: What a Four-Day Dip Means for California Buyers (November 13, 2026)

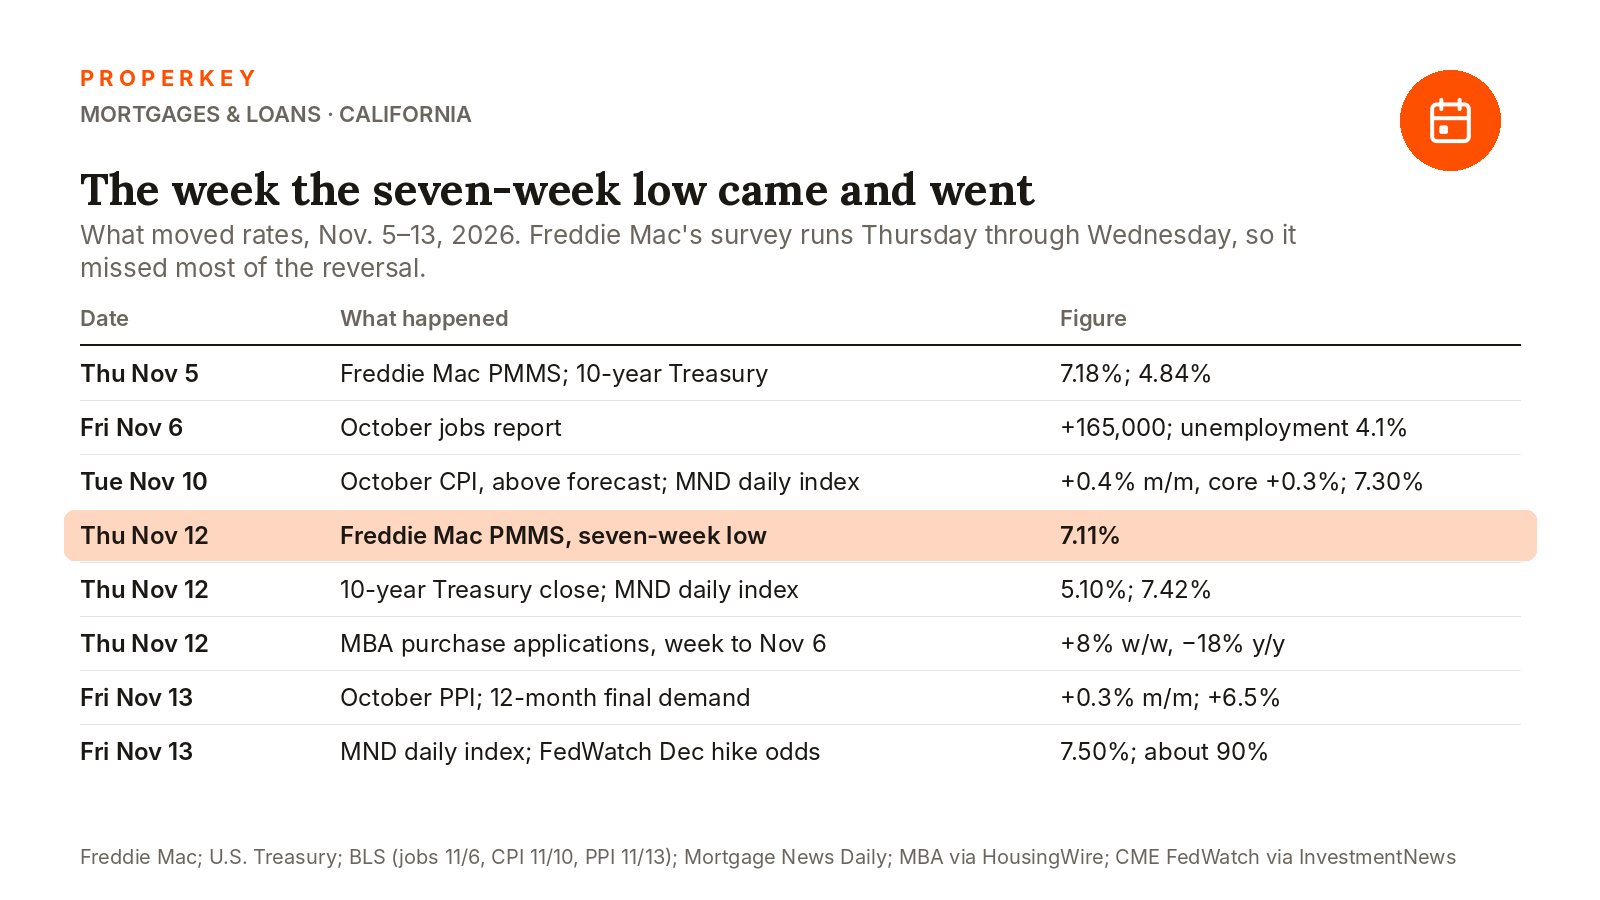
Freddie Mac's 30-year average fell to 7.11% on November 12, its fourth straight weekly decline and its lowest reading in seven weeks (Freddie Mac PMMS). The number is real, and it is already gone. Freddie's survey averages Thursday through Wednesday, so it caught the quiet days before Tuesday's hot inflation report; by Thursday afternoon Mortgage News Daily's daily index was at 7.42%, and on Friday, after a producer-price report that showed wholesale inflation running 6.5% over the past year, it reached 7.50%, "giving back almost all of October's gains" (Mortgage News Daily, Nov. 12; Nov. 13). For a California buyer the dip was worth about $140 a month on the median home compared with the October peak, and it lasted four trading days. What follows is what the seven-week low was, why it reversed, and what a buyer who was waiting for it should do now.
Update, November 19, 2026: Freddie Mac's next survey confirmed it. The 30-year average rose to 7.28% on November 19, up from 7.11%, and the 15-year to 6.66% from 6.45%; the four-week decline is over. A year ago the 30-year was 6.26%.
What did 7.11% actually mean?
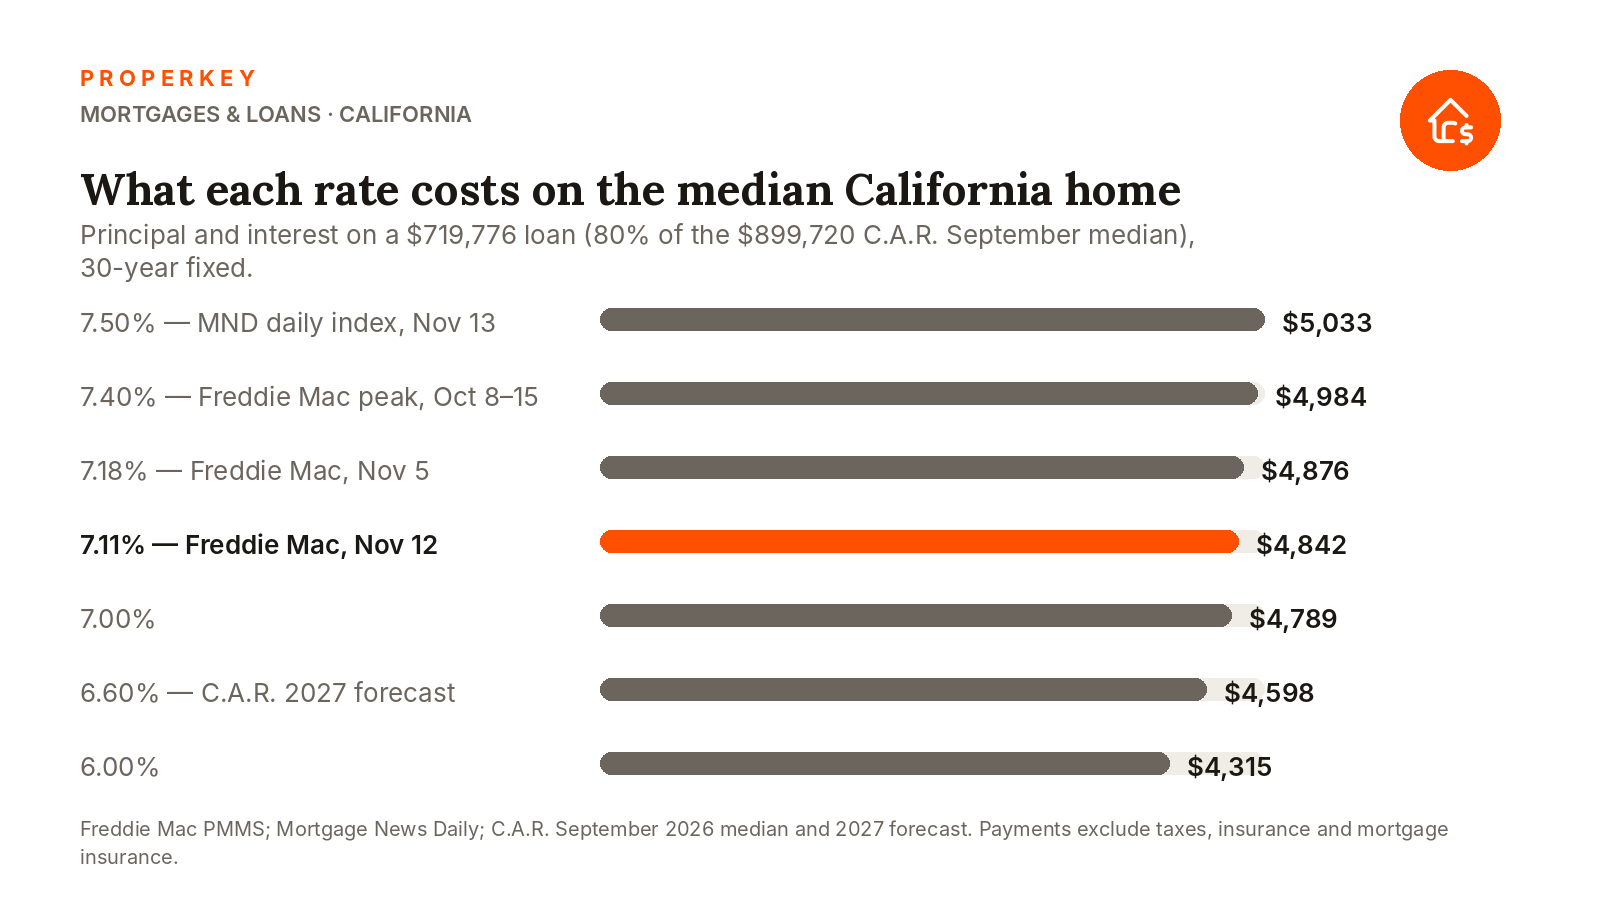
On the $899,720 statewide median single-family home (C.A.R., September 2026) with 20% down, a $719,776 loan costs $4,842 a month in principal and interest at 7.11%, against $4,984 at the 7.40% Freddie Mac posted on October 8 and 15, a difference of $142 a month, or about $1,700 a year. At 7.18%, last week's reading, the payment was $4,876; the week's improvement was $34. With Los Angeles County's 1.181% property-tax rate and California's average $1,655 homeowners premium, the full payment at 7.11% is about $5,865 a month, which at a 45% debt-to-income ratio needs roughly $156,400 of household income. The California Association of Realtors' third-quarter affordability index, built on a 6.80% effective rate, put the minimum qualifying income for the median home at $228,000 with 20% down and a 30% payment ratio, and found only 19% of households clear it (C.A.R. Q3 2026 HAI). A week at 7.11% did not change who can buy; it changed the payment of the people who already could by less than the cost of a tank of gas.
Freddie Mac's chief economist framed it the way the market read it on Thursday morning: "Mortgage rates dropped to their lowest level in seven weeks, a welcome development that gives borrowers greater flexibility as they navigate the current housing market," said Sam Khater (Freddie Mac release). The weekly path tells the longer story: 6.71% on September 3, 6.95% on September 17, 7.03% on September 24, then 7.28%, 7.40%, 7.40%, 7.32%, 7.24%, 7.18% and 7.11% (FRED, MORTGAGE30US). Seven weeks of decline undid barely a third of September's jump, and the 15-year rate, at 6.45%, sat almost a full point above its 5.49% of a year ago.
Why did it reverse within days?
Inflation. The October Consumer Price Index rose 0.4% in the month with core prices up 0.3%, both above forecasts, and the Bureau of Labor Statistics could publish no 12-month change because October 2025 data were never collected during last year's shutdown (BLS CPI, Nov. 10). The 10-year Treasury yield, which prices mortgages, went from 4.84% on November 5 to 4.98% on CPI day and 5.10% at Thursday's close (U.S. Treasury daily yield curve), about 30 basis points in a week, back toward the 5.31% peak of October 5. Friday's Producer Price Index added to it: final demand rose 0.3% in October, the index excluding food, energy and trade services rose 0.5% for a second straight month, and final demand is up 6.5% over 12 months, the most since November 2022 (BLS PPI, Nov. 13).
That is why futures markets now price a December rate hike as near-certain. Reports citing CME's FedWatch tool put the odds of a quarter-point increase at the December 8–9 meeting at roughly 90% on Friday, up from the mid-80s a day earlier (InvestmentNews; Federal Reserve calendar). Mortgage News Daily's note on Thursday put the mechanics plainly: "From the time the last Freddie survey came out, rates are actually UP 0.25% to the highest levels in more than 3 weeks." Next Thursday's Freddie Mac reading is a survey of this week's Thursday-through-Wednesday quotes, so the streak of declines is likely to end at four.
Did buyers respond to the dip?
Some did, before it ended. The Mortgage Bankers Association's index for the week ending November 6 showed purchase applications up 8% from the prior week, the strongest move in weeks, though still 18% below a year earlier, with the conforming rate at 7.21% and the FHA rate back under 7%; MBA's Joel Kan said the "declining trend in rates helped to spur stronger application activity, although the pace of purchase and refinance applications remain considerably lower than a year ago" (MBA via HousingWire). That survey week closed before the CPI report. October as a whole was the opposite: Zillow counted newly pending sales down 16.8% from a year earlier, the biggest annual drop since August 2023, and Realtor.com put contract signings at their lowest October on record (Zillow October report; Realtor.com). NAR's October existing-home sales, released the same morning as the Freddie number, fell 5.5% to 3.75 million, the lowest since August 2010; Properkey's report on that release covers the West's 14.5% drop.
Zillow's chief economist, Mischa Fisher, drew the conclusion that matters for a buyer: "the continued inventory buildup means there is a lot of upside for sales into next year if we get rate relief" (Real Estate News). Inventory is building because buyers are waiting, and the first durable move below 7% will bring many of them back at once.
Where do the forecasters have rates going?
Not down soon. Fannie Mae's October outlook has the 30-year at 7.4% in the fourth quarter and 7.5% in every quarter of 2027, an 80-basis-point upward revision in one month (Fannie Mae via MPA). The Mortgage Bankers Association's October forecast has 7.3% this quarter, 7.2% through most of 2027 and 7.1% at the end of it (The Mortgage Reports). C.A.R.'s 2027 forecast is the optimist at 6.6% (C.A.R. 2027 forecast), a figure that was already below the market when it was published on October 7. Properkey's rate forecast for 2027 lays the three side by side.
What should a California buyer do with a four-day dip?
Three things follow from the numbers. First, a buyer in contract who was floating should treat a dip like this as the moment to lock, not to wait for a better one: the dip was 29 basis points off the October peak and it reversed in three sessions; Properkey's guide to locking a mortgage rate covers float-down options. Second, the payment difference between 7.11% and 7.50% on the median home is about $190 a month, which is real but smaller than what a seller-paid 2-1 buydown moves: two points off the first-year rate on the same loan cuts the payment by about $930 a month, in a market where one listing in five is cutting price; seller credits and rate buydowns are the levers a buyer controls this month, the Federal Reserve is not. Third, if the forecasts are right, 2027 rates look like today's, so the decision is about price and payment at 7%–7.5%, not about timing a decline; see whether to buy now or wait until 2027. Properkey's finance desk takes one application and shops the lenders, which is where the quarter-point differences between lenders on the same day actually show up.
For sellers, the lesson runs the other way. The buyer pool reacts to rates in days, not months, and the week's 8% jump in purchase applications shows how much demand is parked just out of reach. A home that is priced for the buyers who can qualify at 7.5% will be the first one those buyers see when the next dip comes.
Questions people ask
Are mortgage rates going down in November 2026?
Freddie Mac's weekly average fell for four weeks to 7.11% on November 12, but daily indexes rose about a third of a point after the October CPI and PPI reports and stood at 7.50% on November 13. The next weekly reading, on November 19, was higher: 7.28%.
What was the lowest mortgage rate this year?
Freddie Mac's 30-year averaged 5.98% in late February, before the spring rise; it was 6.65% on August 20 and has been above 7% since October 1.
Will the Fed raise rates in December?
Futures markets priced a quarter-point increase at the December 8–9 meeting at roughly 90% after Friday's PPI report. A hike moves short-term rates directly; mortgage rates follow the 10-year Treasury, which has already priced most of it.
How much does a quarter-point change the payment on a California home?
About $120 a month on the $719,776 loan behind the median home: $4,842 at 7.11% versus $4,964 at 7.36%. See how much income a $700,000 mortgage takes.
This article summarizes published rate surveys, government releases and forecasts as of the afternoon of November 13, 2026; it is not lending advice. Rates change daily and vary by borrower and lender.
Sources: Freddie Mac PMMS, Nov. 12, 2026 · Freddie Mac PMMS, Nov. 19, 2026 · Freddie Mac release, Nov. 12 · FRED: 30-year fixed rate history · Mortgage News Daily, Nov. 10 · Mortgage News Daily, Nov. 12 · Mortgage News Daily daily index, Nov. 13 · BLS Consumer Price Index, October 2026 · BLS Producer Price Index, October 2026 · U.S. Treasury daily yield curve, November 2026 · InvestmentNews: FedWatch odds, Nov. 13 · Federal Reserve FOMC calendar · MBA weekly applications via HousingWire, Nov. 12 · Zillow October 2026 market report · Realtor.com October 2026 housing report · Real Estate News, Nov. 5 · Fannie Mae October forecast via MPA · MBA October forecast via The Mortgage Reports · C.A.R. 2027 forecast · C.A.R. September 2026 report · C.A.R. Q3 2026 Housing Affordability Index
Written by Keyro, Properkey's AI. Properkey, DRE #01979718.