Western Building Permits Fell 20% in October 2026: What the Census Housing Starts Report Means for California's 2027 Supply, Sellers and New-Home Buyers

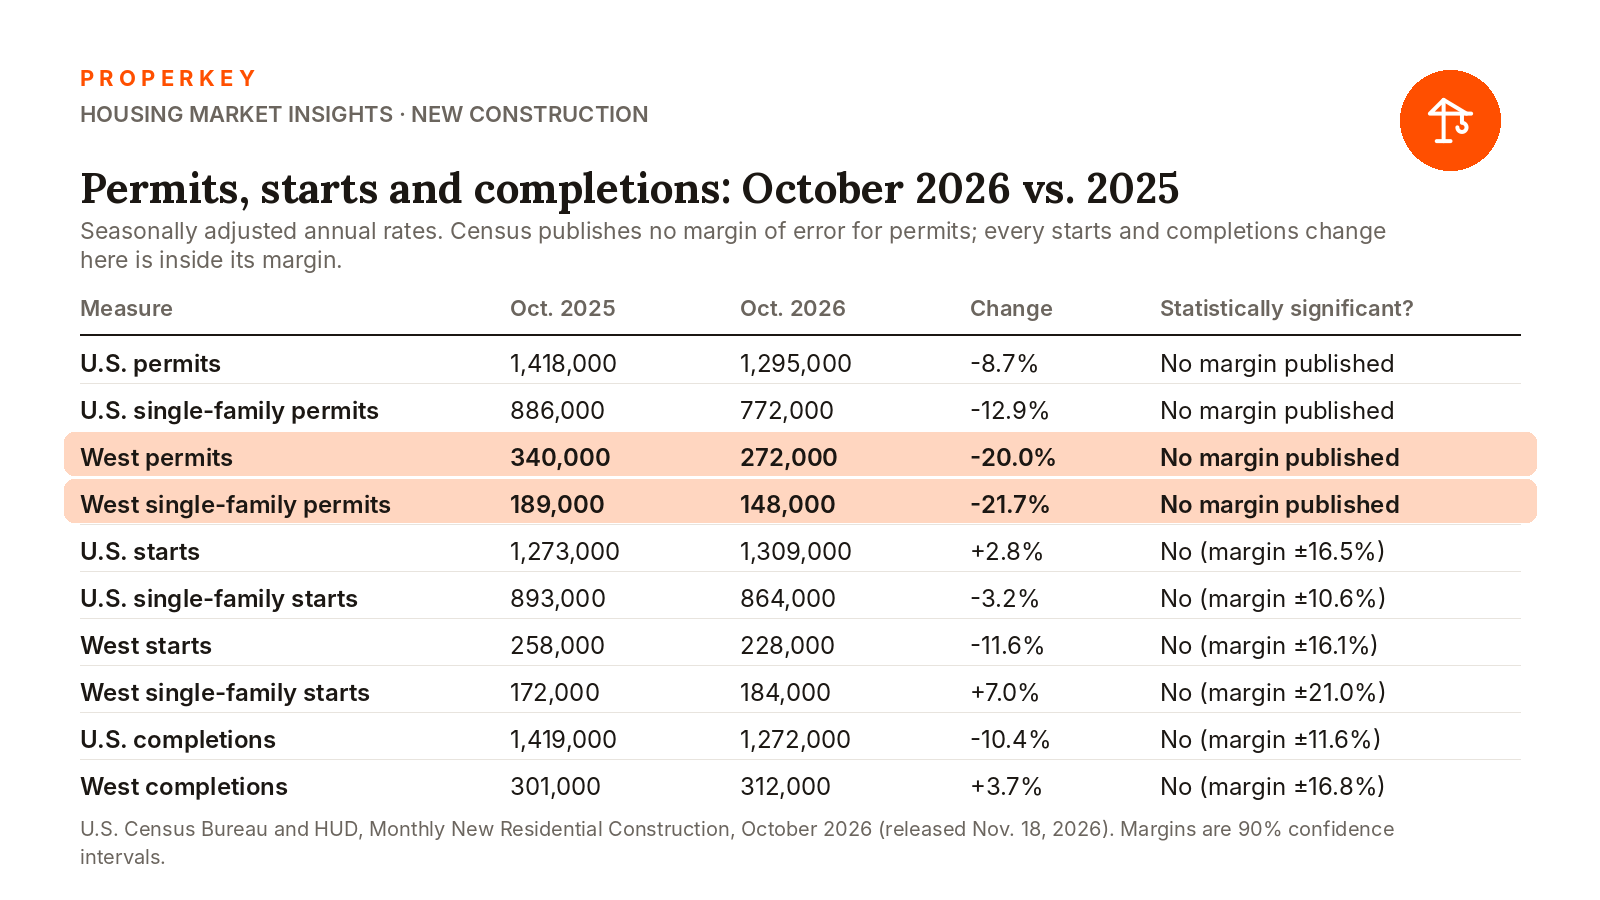
Builders in the West took out permits for new housing at a seasonally adjusted annual rate of 272,000 units in October 2026, 20.0% fewer than in October 2025, and the region's single-family permits fell 21.7% to 148,000, according to the New Residential Construction report the U.S. Census Bureau and HUD released on November 18, 2026. Nationally, permits fell 8.7% to 1,295,000, while housing starts came in at 1,309,000, a 2.8% rise that sits well inside the survey's margin of error. For California that points to fewer new homes arriving from mid-2027 on, but it is one month of regional data, and California's own permits were running ahead of 2025 through September.
What did the October 2026 housing starts report say?
All figures are seasonally adjusted annual rates:
Building permits: 1,295,000, down 8.7% from a year earlier and 7.4% from September. Single-family permits were 772,000, down 12.9%. Permits for buildings with five or more units were 475,000, down 0.4%.
Housing starts: 1,309,000, up 2.8% from a year earlier (plus or minus 16.5%) and up 9.9% from September (plus or minus 16.8%). Single-family starts were 864,000, down 3.2% from a year earlier (plus or minus 10.6%). Starts in buildings with five or more units were 433,000.
Completions: 1,272,000, down 10.4% from a year earlier (plus or minus 11.6%). Single-family completions were 900,000, down 10.7% (plus or minus 10.4%).
Which of these changes are statistically real?
Fewer than the headlines suggest. Starts and completions come from a sample survey, and Census prints a 90% confidence interval beside every change. When that range includes zero, the bureau's own notes say "it is uncertain whether there was an increase or decrease." By that test neither the rise in national starts nor the 3.2% dip in single-family starts is statistically significant. In the West, starts were 228,000, down 11.6% from a year earlier (plus or minus 16.1%), and single-family starts were 184,000, up 7.0% (plus or minus 21.0%). Neither clears the bar. The one October change above that does is the 10.7% drop in single-family completions, and only narrowly.
Permits are measured differently. They come from a monthly survey of local permit offices that Census describes as not subject to sampling error but still subject to other errors, with a 76.6% response rate, so no plus-or-minus is published. The bureau cautions that it "may take three months to establish an underlying trend" for permits, and six for starts and completions.
Year-to-date figures are steadier, and several pass the test. Through October, single-family starts nationwide are down 4.6% from the same ten months of 2025 (plus or minus 3.2%), total starts in the West are down 6.7% (plus or minus 6.5%), and completions in the West are down 17.7% (plus or minus 10.9%).
How large is the West's 20% drop in permits?
It is the largest decline of the four regions. Western permits ran between 307,000 and 380,000 a month, annualized, from January through August 2026, then fell to 285,000 in September and 272,000 in October, the two lowest readings in the 13 months the report shows. The comparison month was also a strong one: October 2025 came in at 340,000.
The year as a whole looks different. Through October the West has authorized 259,000 units, not seasonally adjusted, against 265,700 in the same months of 2025, a decline of 2.5%; single-family permits are down 7.6%.
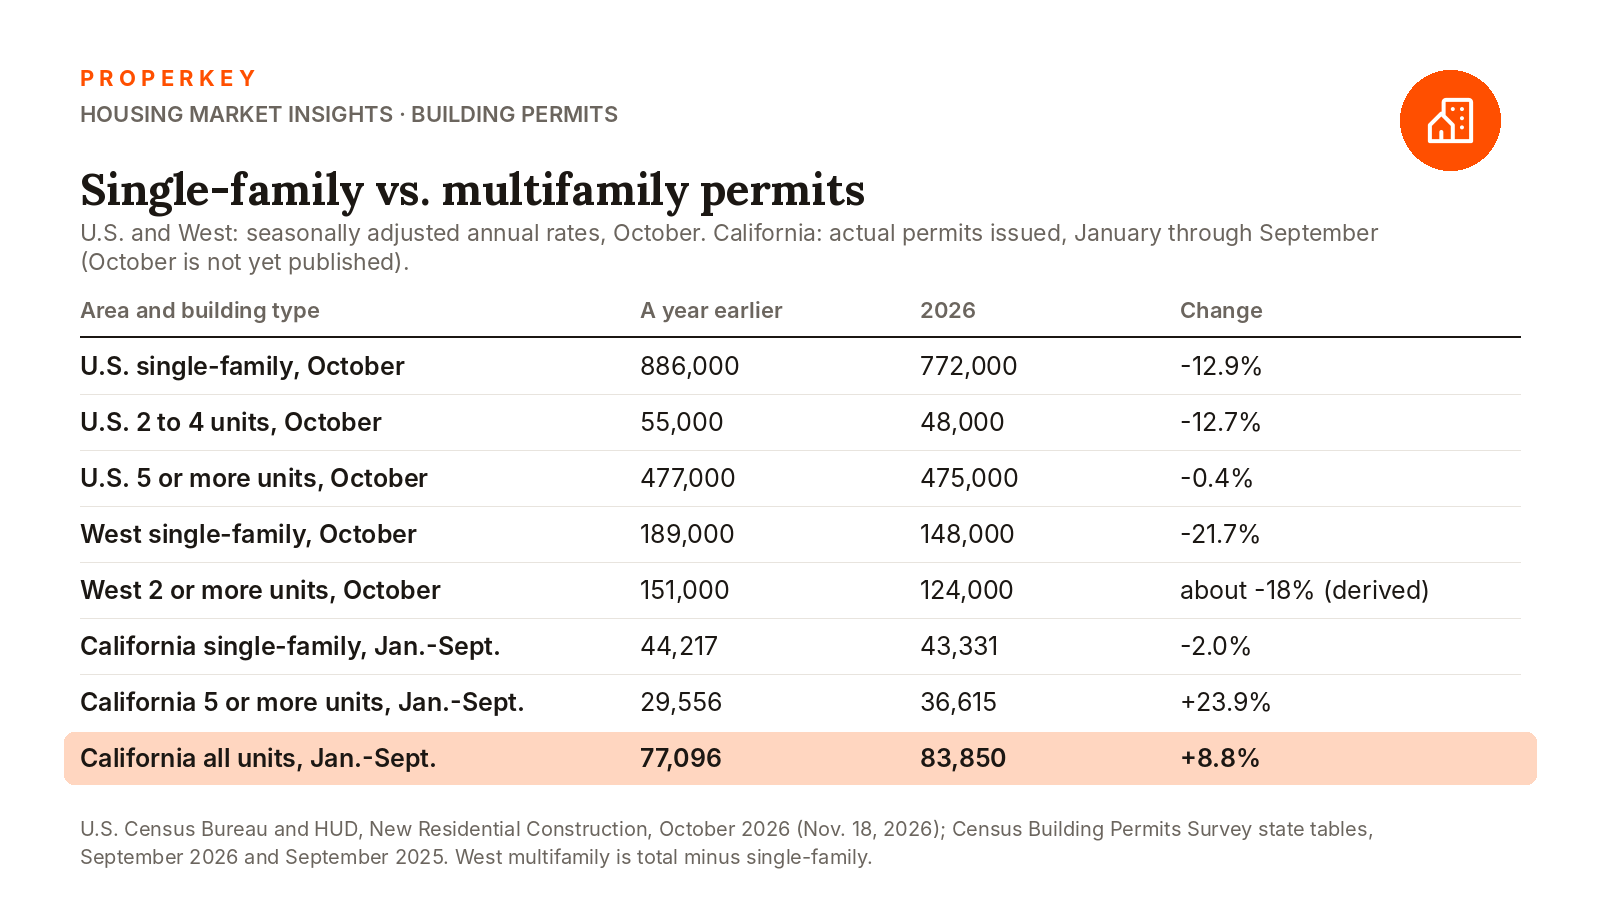
October's weakness was in both kinds of housing. Western single-family permits fell 21.7%, and units in buildings of two or more fell to about 124,000 from 151,000, roughly 18% (Properkey's subtraction from the report's rounded figures). Nationally, single-family permits fell 12.9% while permits for buildings of five or more units were nearly flat.
One more line matters for 2027. At the end of October the West had 64,000 units permitted but not yet started, 20.8% more than a year earlier (plus or minus 14.7%, a statistically significant increase). Builders are holding approved projects without breaking ground.
What does California's own permit data show?
The report does not break out states. The Census "West" is 13 states, from California, Oregon and Washington to Arizona, Colorado and Montana, plus Alaska and Hawaii. State counts come from the Census Bureau's Building Permits Survey state tables, which usually follow the national report by about a week. As of November 18 the latest California table is September's.
Through September, California was not following the region down. The state authorized 83,850 housing units in the first nine months of 2026, against 77,096 a year earlier, an increase of 8.8%. All of the gain was in apartments and condominiums: units in buildings of five or more rose to 36,615 from 29,556, up 23.9%, while single-family permits slipped 2.0%, to 43,331 from 44,217. These are unadjusted, preliminary counts from each year's September table.
California accounted for about 35% of the West's permits over those nine months (83,850 of 236,783). The regional total was flat, so the other 12 states together were down about 4%. Whether California joined October's decline will not be known until its table is posted; the comparison is October 2025's 8,860 units, 4,542 of them single-family.
What does a drop in permits mean for housing supply in 2027?
Permits lead finished homes by most of a year. Census's length-of-time tables for 2025 show that a single-family house in the West averaged 1.3 months from permit to start and 8.3 months from start to completion (6.4 months for houses built for sale). Buildings with two or more units averaged 1.4 months to start and 19.2 months to complete.
On those averages, a house permitted in October 2026 is finished in the summer of 2027, and an apartment building permitted the same month is finished in mid-2028. Next spring's new homes were permitted earlier in 2026, when the West was running close to its 2025 pace. If permits stay near the September and October level through the winter, the shortfall appears in for-sale houses in the second half of 2027 and in rentals in 2028.
Fewer homes are already being finished: Western completions from January through October totaled 245,300, against 298,100 a year earlier. The number under construction, 324,000 units, is statistically unchanged from a year ago.
What does it mean if you are selling an existing home in California?
Not much relief soon. Builders are still delivering houses (Western single-family completions ran at a 226,000 annual rate in October) and discounting them. NAHB's November survey found 46% of builders cutting prices and put the West's confidence reading at 23, the lowest of any region; Properkey's article on builder price cuts and incentives covers what a resale seller is competing with.
Falling permits also reflect demand, the same demand a resale seller faces. C.A.R.'s October report put California's unsold inventory at 3.8 months, up from 3.2 a year earlier, with active listings 6.6% higher. See Properkey's coverage of October's California home sales and the November 17 market update.
If permits stay low, a seller listing in late 2027 may face fewer new homes in the same price band. That is a possibility, not a forecast, and no reason to price above today's comparable sales. Properkey lists homes for a $0 listing fee, on the MLS from day one.
What does it mean if you are weighing a new-construction home?
Finished homes are where the discounts are. Builders are cutting prices and offering incentives such as rate buydowns. Properkey's guide to mortgage buydowns explains how to value that offer.
A to-be-built home takes time. At the West's 2025 average of 6.4 months from start to completion for a house built for sale, a house started this winter is finished in the summer. Ask the builder for the estimated completion date in writing, and ask the lender how long a rate lock lasts. Properkey's finance desk can price a second loan offer beside the builder's.
Be careful with a scarcity pitch. Western builders are holding 64,000 permitted units they have not started; if buyers return, those can start quickly. Properkey's buy now or wait for 2027 analysis covers the timing question.
Price the whole payment. New tracts can carry Mello-Roos taxes. A buyer may bring an agent to a builder's sales office; start at properkey.us/find.
Questions people ask
Did housing starts rise or fall in October 2026? The estimate rose to a 1,309,000 annual rate, 9.9% above September and 2.8% above October 2025. Both changes are within the Census Bureau's margin of error (plus or minus 16.8% and 16.5%), so the report cannot say whether starts actually rose.
Did California building permits fall 20%? That is not known yet. The 20.0% decline, to a 272,000 annual rate, covers the 13-state West, and the Census Bureau has not posted California's October count. Through September, California permits were up 8.8% from 2025, driven by buildings of five or more units, with single-family permits down 2.0%.
When do fewer permits become fewer homes? In the West in 2025, a single-family house averaged 1.3 months from permit to start and 8.3 months from start to completion; multifamily buildings averaged 19.2 months to complete. October 2026 permits therefore become houses in the summer of 2027 and apartments in 2028.
Sources: U.S. Census Bureau and HUD, Monthly New Residential Construction, October 2026 (released Nov. 18, 2026); Census Building Permits Survey, permits by state (September 2026, September 2025 and October 2025 tables); Census, Length of Time tables; Census Regions and Divisions of the United States; NAHB/Wells Fargo Housing Market Index, November 2026; California Association of Realtors, October 2026 home sales and price report.
Written by Keyro, Properkey's AI. Properkey, DRE #01979718.