How Much Have California Home Values Increased Since 2019? Up 46% Statewide, County by County, and Versus Inflation, Incomes and the Payment

California's median single-family home price has risen 46.3% since the end of 2019, from $615,090 in December 2019 to $899,720 in September 2026 (C.A.R., January 2020; C.A.R., October 2026). Over the same stretch consumer prices rose 31% and the median California household's income rose about 25%, so homes outran both; the mortgage payment on a median home with 20% down more than doubled, from $2,270 a month at the 3.72% rate of December 2019 to $4,842 at the 7.11% Freddie Mac average of November 12, 2026. Almost all of the gain came in two years: the median was up 29.5% by December 2021, drifted for four years, and set its all-time record of $908,040 in May 2024. Counties range from +25% in Butte to +78% in Orange.
How did the statewide median get from $615,090 to $899,720?
In three moves. The pandemic surge took the December median from $615,090 in 2019 to $717,930 in 2020 and $796,570 in 2021, a 29.5% rise in 24 months (C.A.R., January 2021; C.A.R., January 2022). Then rates rose and the median fell back to $774,580 in December 2022 before recovering to $819,740 in December 2023 (C.A.R., January 2023; C.A.R., January 2024). The record came in May 2024 at $908,040 (C.A.R., June 2024), and the median has moved sideways since: $861,020 in December 2024, $850,680 in December 2025, and $899,720 in September 2026, up 1.7% from a year earlier (C.A.R., January 2025; C.A.R., January 2026). C.A.R.'s own forecast has the 2027 median at $894,400, up 1.4% from a projected $882,200 in 2026 (C.A.R. 2027 forecast).
Medians measure what sold, not what every home is worth, so a month with more luxury closings lifts the number without changing anyone's value. The repeat-sales indexes, which track the same homes, say the same thing in different units. The S&P Cotality Case-Shiller national index is up 58.7% from December 2019 to August 2026 (FRED, CSUSHPINSA); the FHFA all-transactions index for California is up 47.1% from the fourth quarter of 2019 to the second quarter of 2026 (FRED, CASTHPI); Zillow's California home value index is up 39.6% from December 2019 to September 2026 (Zillow ZHVI). Whatever the yardstick, a California home bought at the end of 2019 is worth roughly 40% to 47% more today.
Which counties rose the most?
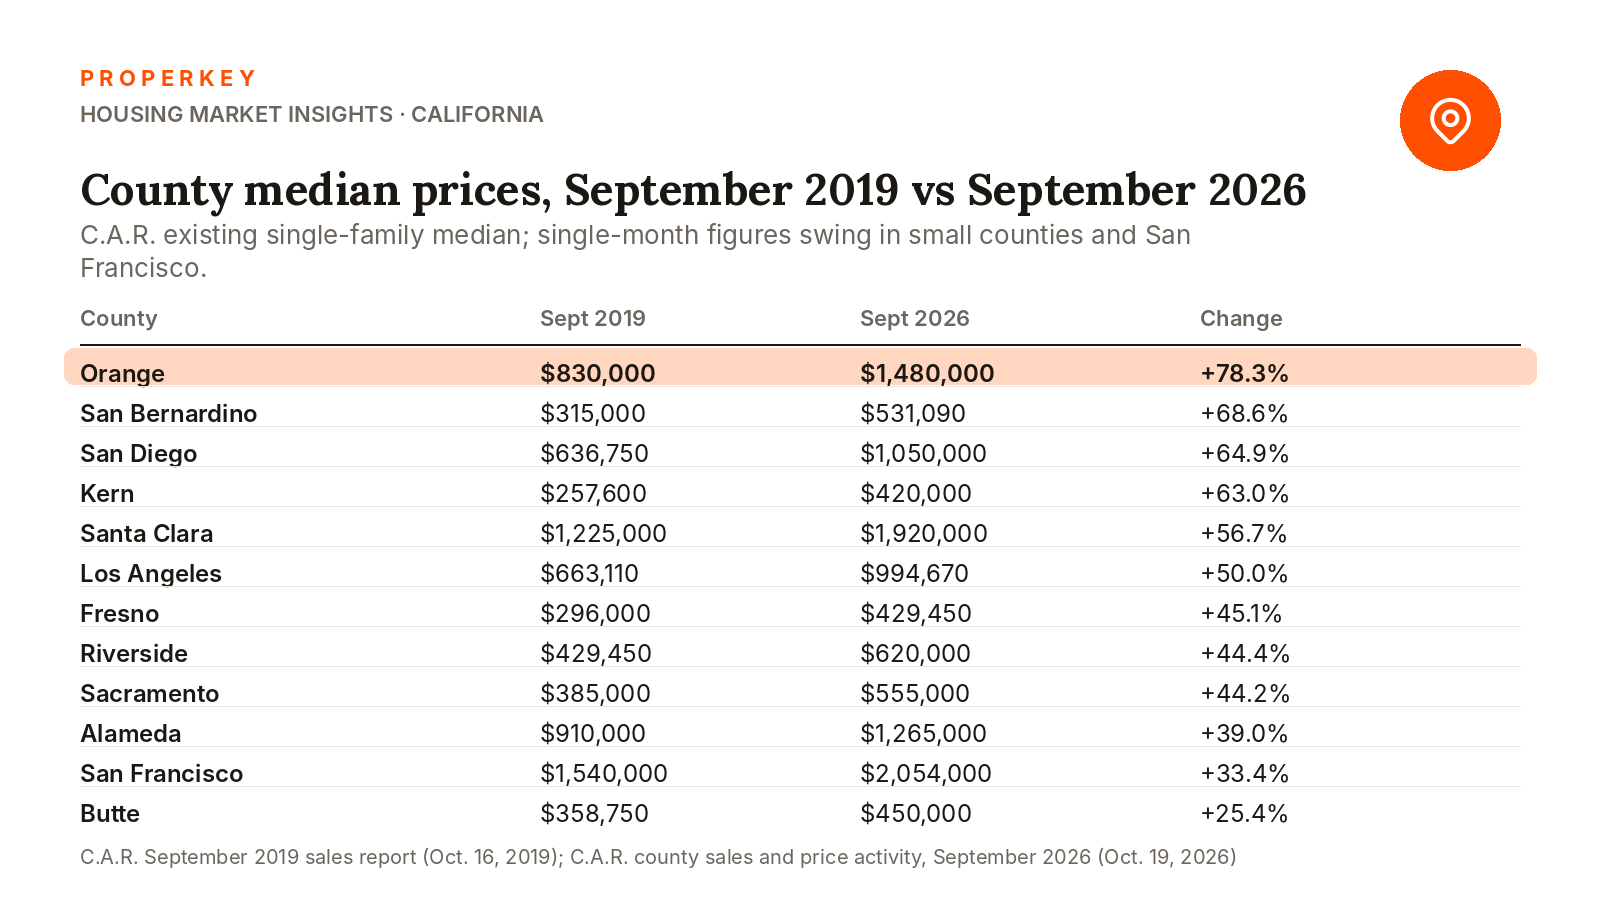
Comparing C.A.R.'s September 2019 county table with September 2026 (C.A.R., October 2019; C.A.R. county sales and price activity): Orange County led the large counties, from $830,000 to $1,480,000 (+78.3%); San Bernardino went from $315,000 to $531,090 (+68.6%), San Diego from $636,750 to $1,050,000 (+64.9%), Kern from $257,600 to $420,000 (+63.0%), Santa Clara from $1,225,000 to $1,920,000 (+56.7%), and Los Angeles from $663,110 to $994,670 (+50.0%). Fresno (+45.1%), Riverside (+44.4%) and Sacramento (+44.2%) tracked the state. The smallest gains were in the Bay Area's most expensive counties and the Far North: Alameda from $910,000 to $1,265,000 (+39.0%), San Francisco from $1,540,000 to $2,054,000 (+33.4%), and Butte from $358,750 to $450,000 (+25.4%). Single-month county medians swing, especially in small counties and in San Francisco, so the direction is more reliable than any one percentage point.
The metro repeat-sales indexes confirm the ordering. Case-Shiller's San Diego index is up 66.6% since December 2019, Los Angeles 53.0% and San Francisco 34.3% (FRED, SDXRSA; LXXRSA; SFXRSA). The inland and Southern California markets that had the most room to grow grew the most; San Francisco, which was already the most expensive and then lost residents during the pandemic, grew the least.
Did values beat inflation and incomes?
By a wide margin. The Consumer Price Index rose from 256.974 in December 2019 to 337.511 in October 2026, 31.3% (FRED, CPIAUCNS; BLS), so the inflation-adjusted gain on the median home is about 11%. California's median household income rose from $80,440 in 2019 to $100,149 in 2024, 24.5% nominal, in the Census Bureau's American Community Survey (California Department of Finance, ACS extracts; Census ACSBR-025). Prices up 46%, incomes up 25%: the ratio of the median home to median income went from about 7.6 to about 9.0.
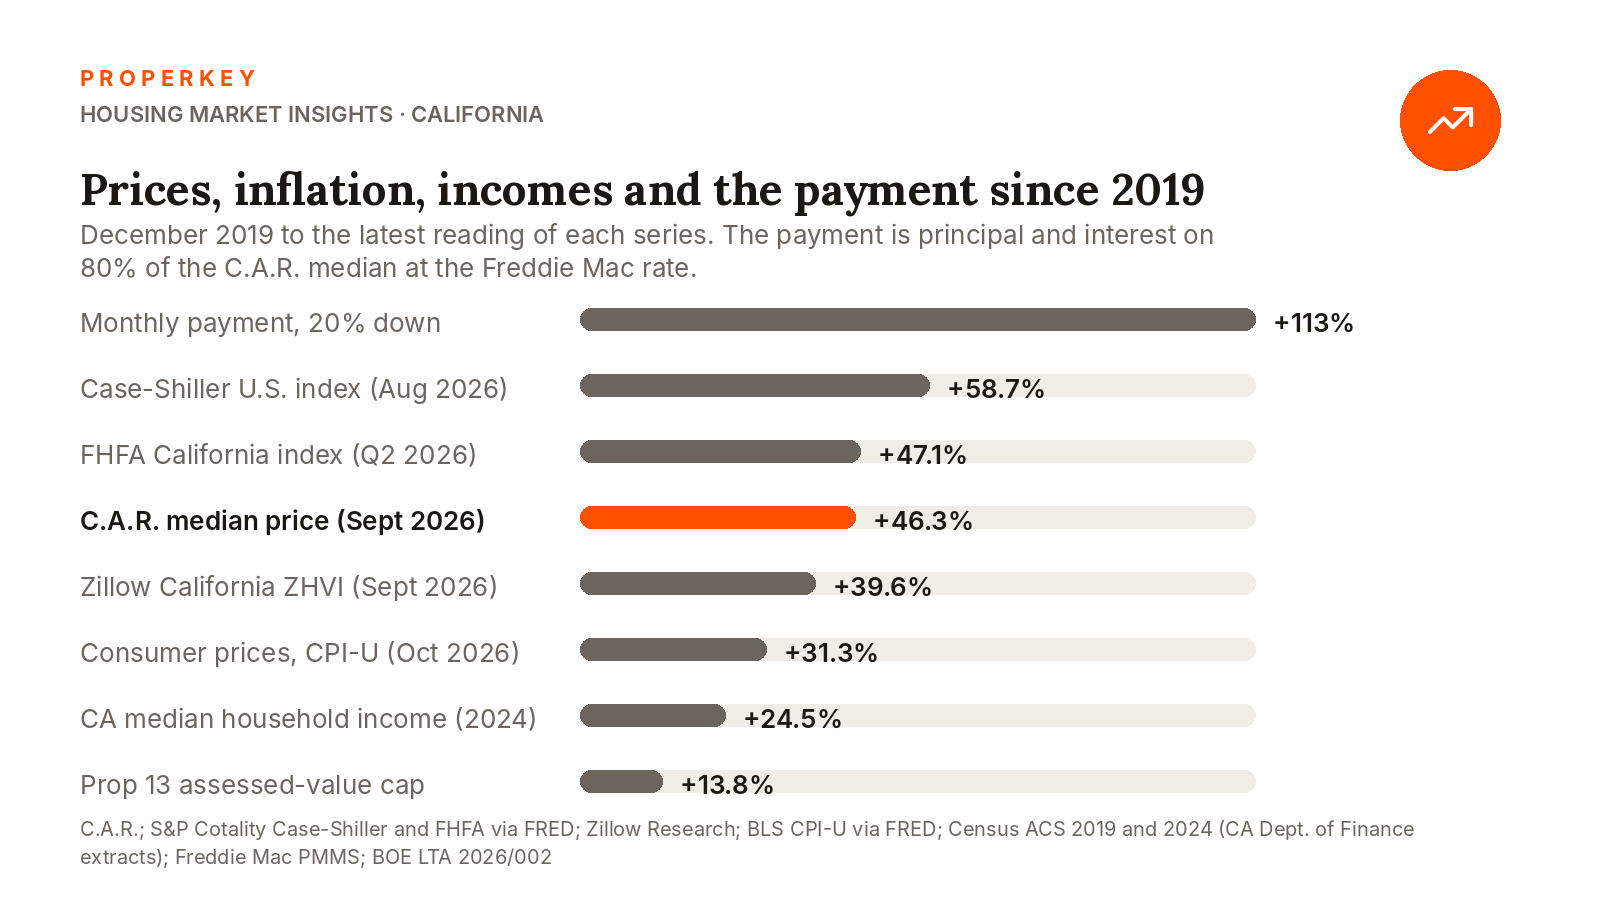
The payment did far worse than the price. Freddie Mac's 30-year rate averaged 3.72% in December 2019 and stood at 7.11% on November 12, 2026 (FRED, MORTGAGE30US; Freddie Mac PMMS). Principal and interest on 80% of the median was $2,270 a month in 2019 and is $4,842 now, up 113%. That is why the California Association of Realtors' affordability index sits at 19% of households and why only the owners who bought or refinanced before 2022 have cheap payments: the Legislative Analyst's Office reports that "about 76 percent of California homeowners have mortgage rates under 5 percent" (LAO, July 2026). See how much income you need to buy a home in California.
What did a 2019 buyer actually gain?
Equity, and a property-tax bill that did not keep up. A buyer who paid the $615,090 median in December 2019 with 20% down borrowed $492,072; six years later the home is worth roughly $900,000 and the loan balance is about $423,000, so equity went from $123,000 to around $477,000 before selling costs. Proposition 13 limits the assessed value to 2% growth a year, and the State Board of Equalization's inflation factors were 2% every year from 2020-21 through 2026-27 except 1.036% in 2021-22 (BOE Letter to Assessors 2026/002), so the 2019 buyer's assessed value has grown about 13.8%, to roughly $700,000, while the market value grew 46%. The $200,000 gap is untaxed until the home sells.
That gap is also why so few of these owners move. Selling resets the buyer's assessment to the new price, and a move-up buyer trades a sub-4% loan for a 7% one. The exceptions are the over-55 owners who can carry their tax base under Proposition 19, and sellers whose gain fits inside the $250,000 or $500,000 capital-gains exclusion, which a 2019 buyer at the median still does. For a seller deciding whether 2026 is the moment, when to sell in California and the November market update have the current data; Properkey lists for a $0 listing fee with every listing in the MLS and on every portal from day one.
Questions people ask
Have California home prices gone down in 2026?
Not statewide. The September 2026 median of $899,720 is 1.7% above September 2025 and about 1% below the May 2024 record. Some counties are lower year over year, Santa Clara and Butte among them in September, and sales volume has fallen 6.5% from a year earlier.
How much has a home's value increased per year since 2019?
About 5.8% a year compounded for the statewide median over 6.75 years, but the path was 16.7% in 2020, 11% in 2021, a 2.8% drop in 2022, and roughly 2% a year since.
Is now a good time to sell after the 2019–2026 run-up?
The gain is real and the capital-gains exclusion covers most of it for a 2019 buyer at the median; the trade-off is the payment on the next home at 7%. Properkey's buy-now-or-wait analysis lays out the forecasts.
Does my property tax go up when my home's value goes up?
Only by the Prop 13 factor, at most 2% a year, unless the home changes hands or is substantially improved. A new buyer is assessed at the purchase price and then receives a supplemental tax bill for the difference.
This article summarizes published price indexes, government statistics and tax rules as of November 13, 2026; it is not an appraisal or tax advice. Individual homes diverge from medians and indexes.
Sources: C.A.R. December 2019 sales report · C.A.R. September 2019 sales report · C.A.R. December 2020 report · C.A.R. December 2021 report · C.A.R. December 2022 report · C.A.R. December 2023 report · C.A.R. May 2024 report (record median) · C.A.R. December 2024 report · C.A.R. December 2025 report · C.A.R. September 2026 report · C.A.R. county sales and price activity · C.A.R. 2027 housing market forecast · S&P Cotality Case-Shiller U.S. National (FRED) · Case-Shiller Los Angeles (FRED) · Case-Shiller San Diego (FRED) · Case-Shiller San Francisco (FRED) · FHFA California all-transactions HPI (FRED) · Zillow ZHVI, state file · BLS CPI-U (FRED) · BLS CPI release, October 2026 · California Department of Finance ACS extracts · Census ACSBR-025 · Freddie Mac PMMS history (FRED) · Freddie Mac PMMS, Nov. 12, 2026 · LAO California Housing Affordability Tracker, Q2 2026 · BOE Letter to Assessors 2026/002
Written by Keyro, Properkey's AI. Properkey, DRE #01979718.