How the First-Time Homebuyer Has Changed Since 1981: From 29 Years Old and 44% of the Market to 40 and 22% (NAR 2026 Profile)

The typical first-time homebuyer in 1981 was 29 years old, married, and one of 44 out of every 100 buyers. In 2026 the typical first-time buyer is 40, as likely as not to be single, and one of 22 out of 100. Those are the National Association of Realtors' own numbers: its 2026 Profile of Home Buyers and Sellers, released November 5, 2026, puts the first-time share at 22% (up one point from 2025's record low), the median first-time age at 40 (matching the record), and a record 10% of first-time buyers paying all cash, 28% of them with an inheritance. The series began in 1981, so the comparison below runs 45 years on the NAR data and 50 on the Census and Freddie Mac data around it. The short version: the first home now comes about a decade later in life, after marriage rather than before it, and increasingly with family money attached.
How many buyers are first-timers?
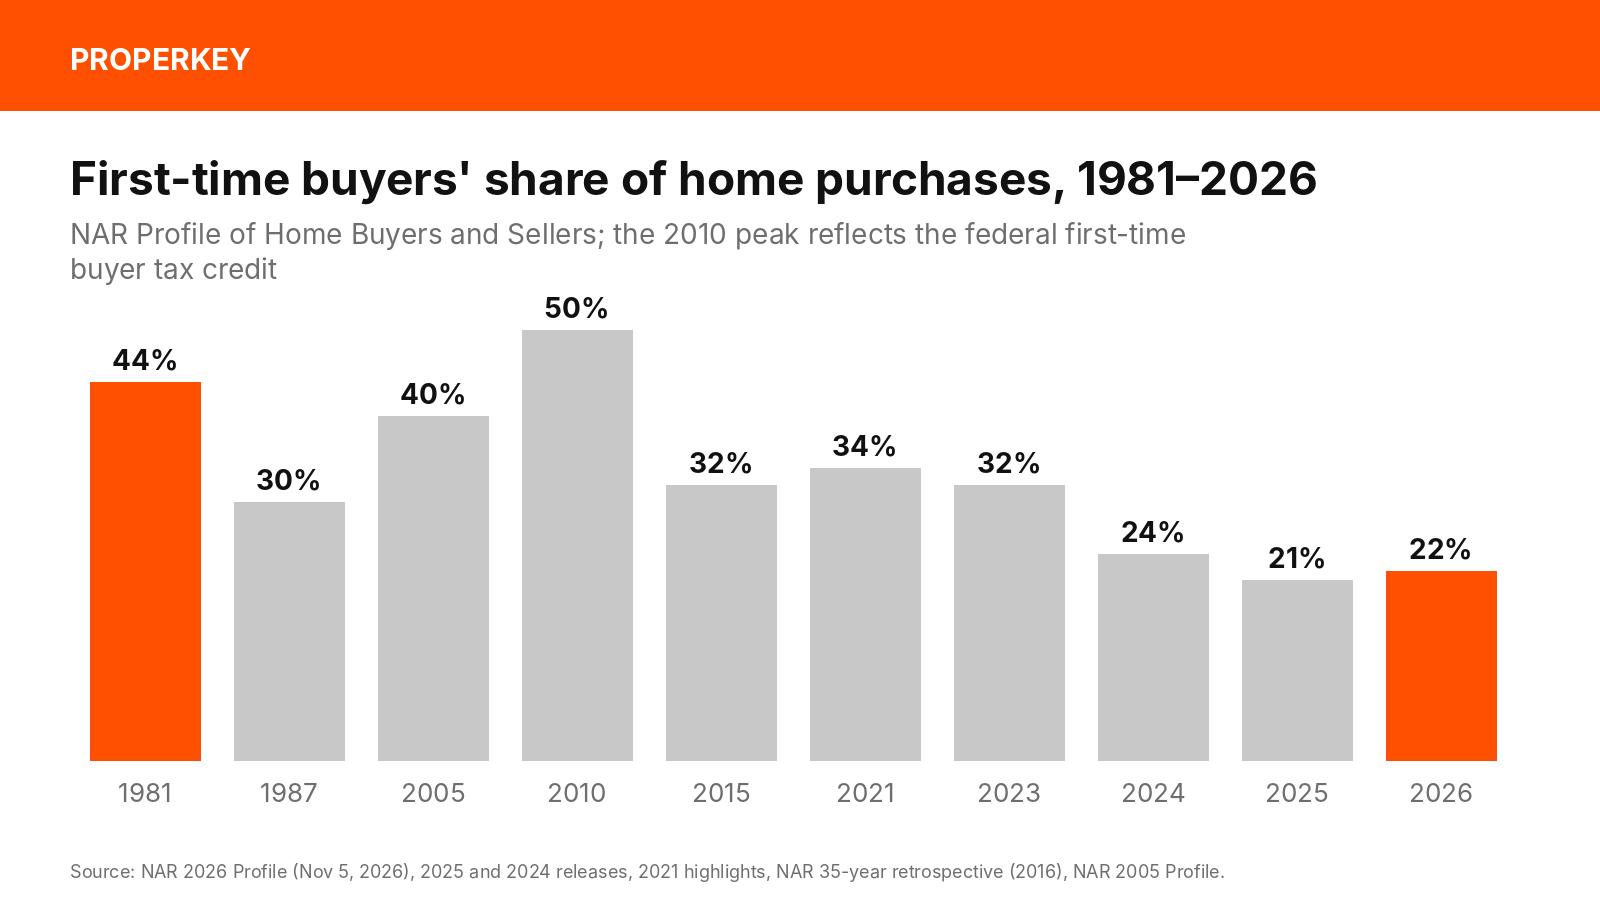
NAR's first survey, in 1981, found first-time buyers were 44% of home purchases; the share fell to 30% by 1987, ran near 40% through the 2000s, and spiked to 47% in 2009 and 50% in 2010 under the federal first-time buyer tax credit (NAR's 35-year retrospective, 2016). It was 32% in 2015, 34% in 2021, 26% in 2022 and 32% in 2023, then 24% in 2024 and 21% in 2025, which NAR called the lowest share since data collection began. The 2026 figure, 22%, is a one-point recovery from the floor. NAR's long-run average before 2008 was about 40%; its chief economist's line in 2025 was that the first-time share "has contracted by 50% since 2007."
Two cautions on reading that drop. The Profile measures primary-residence purchases over a July-to-June year, so a 22% share in a year of roughly 4 million existing-home sales is about 900,000 first-time households, down from roughly 2 million a year in 2009–2010, when the share was 47–50% on similar sales volumes. And NAR's separate monthly existing-home-sales survey, which asks agents rather than buyers, still shows first-timers at 31% of September 2026 closings; the two measures differ in method and the Profile is the one with the 45-year history.
How old is the first-time buyer now, and how old were they then?
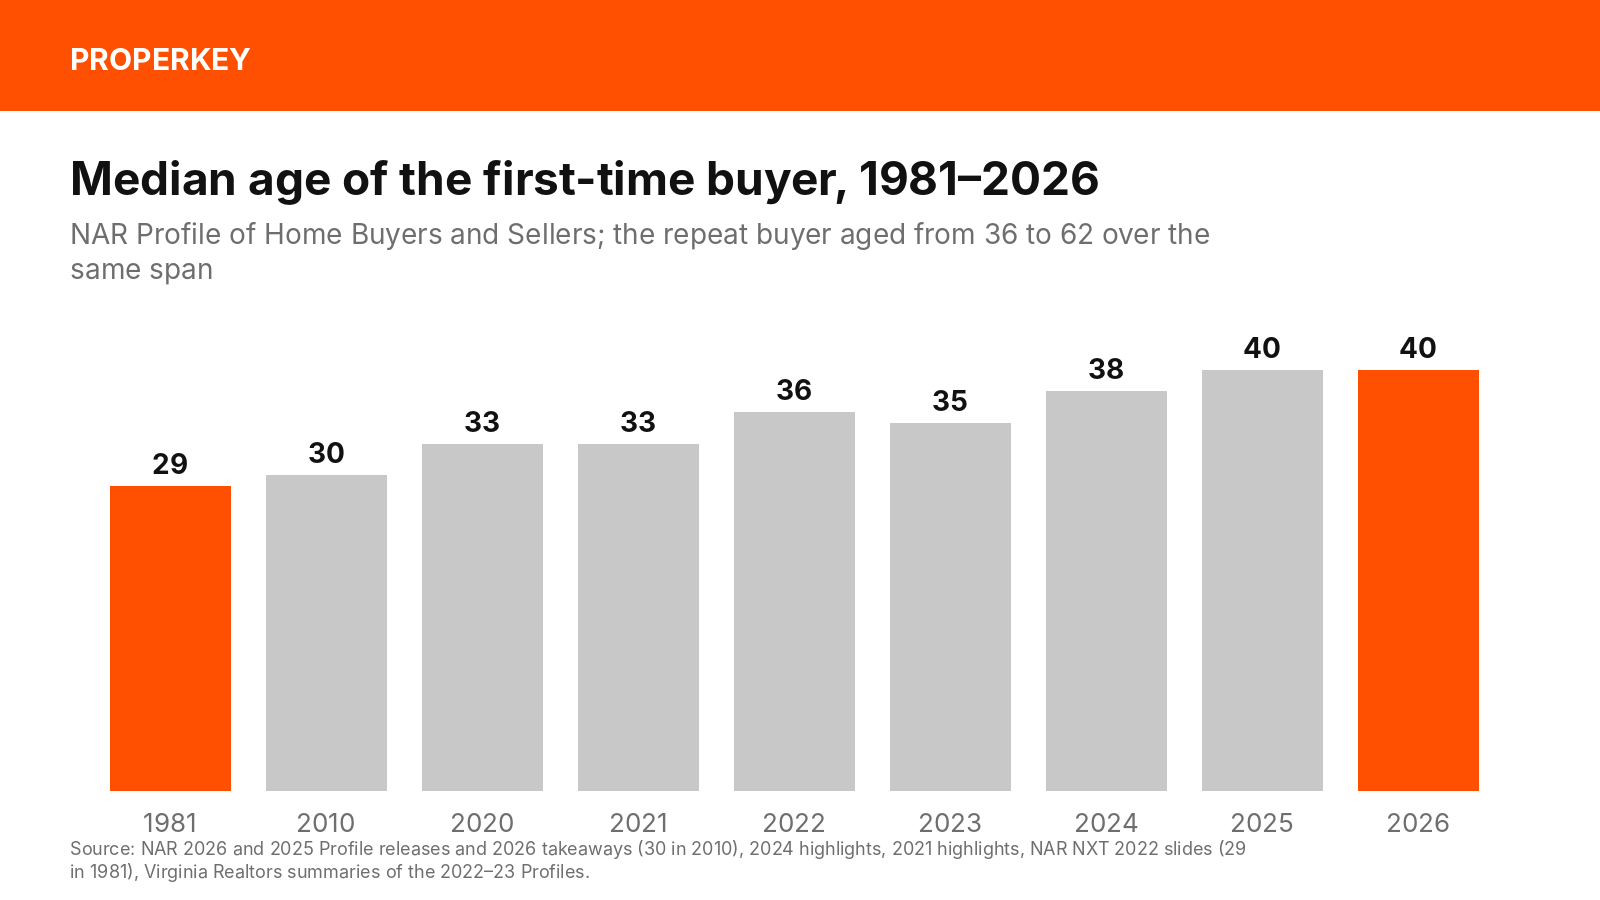
NAR's data put the median first-time buyer at 29 in 1981, 30 in 2010, 33 in 2020 and 2021, 36 in 2022, 35 in 2023, 38 in 2024 and 40 in both 2025 and 2026, per the Profile releases and NAR's 2026 takeaways. The median repeat buyer aged from 36 in 1981 to 62 today, and the median seller is 63 and has owned for a record 12 years. The age shift is not only about affordability; adult life rescheduled around it. The Census Bureau's median age at first marriage was 24.8 for men and 22.3 for women in 1981; in 2025 it was 30.8 and 28.4. In 1981 the typical buyer bought before marrying; in 2026 the typical first-time buyer is a decade past the median wedding age, and NAR reports 21% of first-time buyers moved straight from a family member's home, versus 12% in 1993.
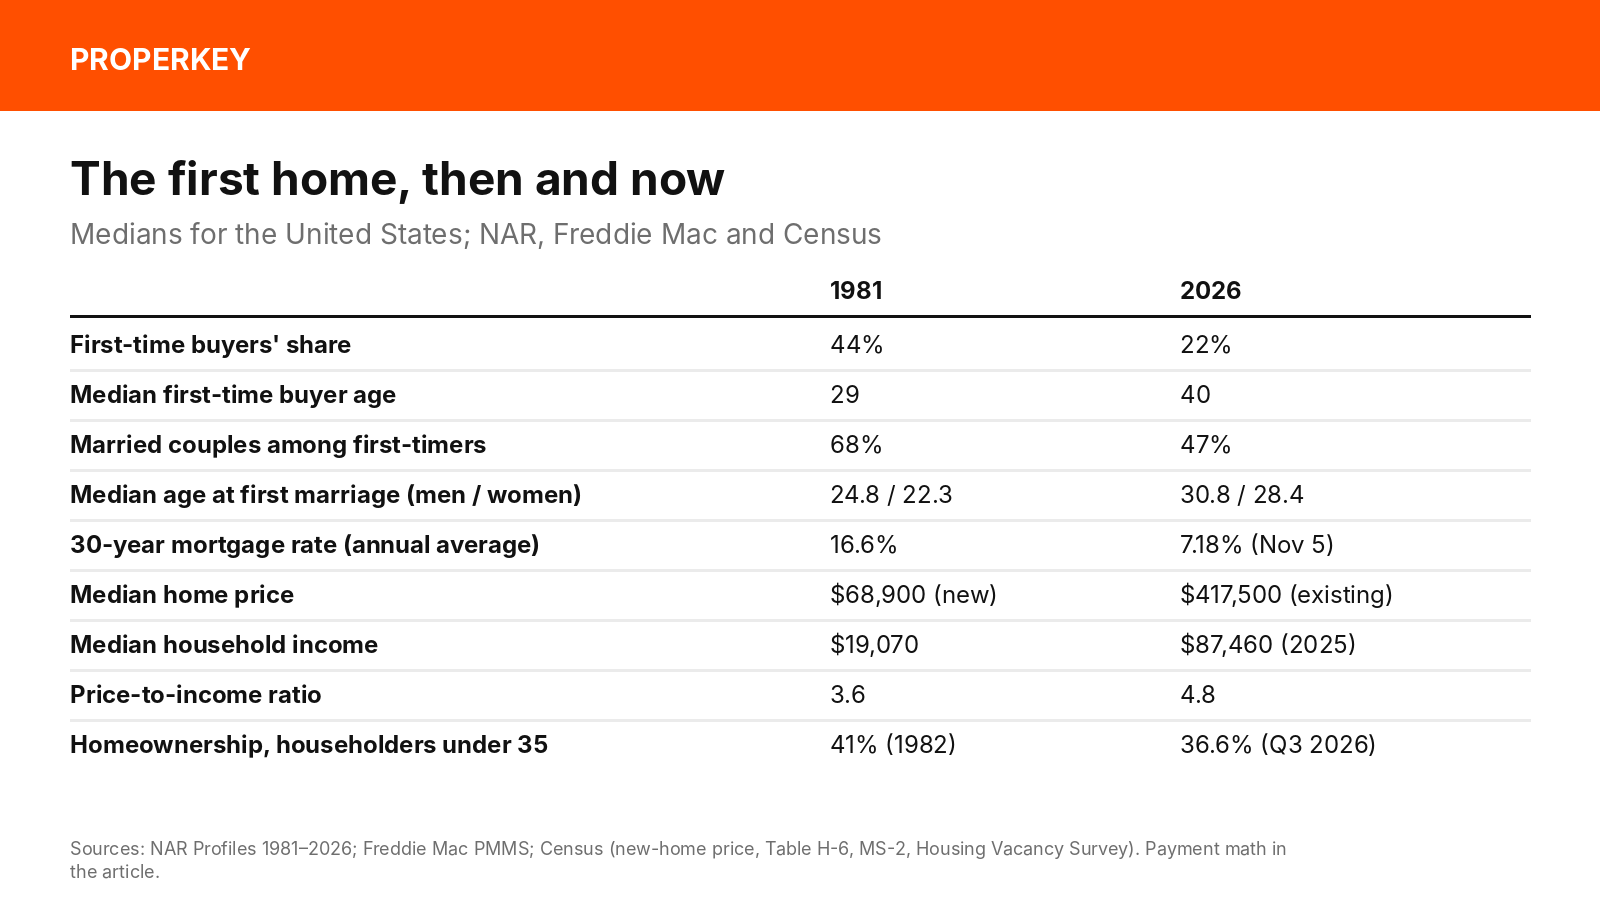
Who the buyer is has changed as much as the age. NAR's 1981 first-time buyers were 68% married couples, 12% single women and 13% single men; in 2026 they are 47% married couples, 25% single women, 12% single men, 11% unmarried couples and 5% groups of roommates, the highest roommate share in the survey's history.
What did the first home cost, then and now?
The 1981 buyer faced the worst mortgage rate in the Freddie Mac record: the 30-year fixed averaged 16.6% for the year and peaked at 18.63% in October 1981 (the 1976 average was 8.9%). The Census median new-home price was $68,900 in 1981 ($44,200 in 1976), against a Census median household income of $19,070, a price-to-income ratio of about 3.6. In 2026 the 30-year fixed is 7.18% (Freddie Mac, November 5), the NAR existing-home median is $417,500 and the median household income (2025) is $87,460: a ratio of about 4.8. On those medians the 1981 buyer's principal-and-interest payment on an 80% loan at 16.6% was about $770 a month, 48% of the median income; the 2026 buyer's payment on an 80% loan at 7.18% is about $2,263, 31% of the median income. Rates were far worse in 1981; prices relative to income are far worse now, and the down payment, which scales with price, is the part that moved out of reach.
That is why the down payment is where the generational transfer shows up. The median first-time down payment is 9% (repeat buyers 19%), and NAR reports first-time buyers funding it from savings (62%), stocks and retirement accounts (30%), gifts or loans from family (25%) and inheritance (10%, a record). The 10% of first-time buyers who paid all cash have a median age of 54, against 38 for financed first-timers. NAR's deputy chief economist Jessica Lautz: "It's not yet a tsunami, but it is changing who can buy a first home and when." Median first-time buyer income is $100,000 in the 2026 Profile, up from $94,400 a year earlier.
The ownership outcome follows. Census Housing Vacancy Survey data put the homeownership rate for householders under 35 at about 41% in 1982; the third-quarter 2026 rate is 36.6%, against 65.5% for all households.
What does this look like in California?
Harder, by a wide margin. C.A.R.'s third-quarter 2026 Housing Affordability Index says 19% of California households can afford the $894,630 median home, which takes $228,000 of income; its First-Time Buyer index, built on an entry-level home at 85% of the median ($760,440) with 10% down, says 34% can, on an income of $149,700 and a $4,990 monthly payment. The statewide median was $899,720 in September 2026. A 9% down payment on the entry-level home is about $68,000; on the median it is $81,000. Properkey's county-by-county guide to the income needed to buy in California has the local numbers, and its guide to where a $180,000 loan still buys a house covers the counties where a 1981-style first purchase is still possible.
Two things are new for the 2027 first-time buyer here. Proposition 37, approved on November 3, 2026, creates a CalHFA second mortgage of up to 17% of the price behind a 3% buyer contribution, on newly built homes only, for households up to 200% of area median income; the measure gives CalHFA one year from its effective date to implement it. Until then the existing routes are CalHFA's MyHome deferred second (3.5% of price on FHA, 3% conventional), FHA's 3.5% down, and Fannie Mae's and Freddie Mac's 3%-down conventional programs. Properkey's finance desk shops all of them on one application through properkey.us/finance, and its buyer service starts with the state-required buyer agreement, so the fee is known before the first showing. Properkey's guide to buying with or without an agent explains that rule.
What should a first-time buyer take from 45 years of data?
Three things. Buying at 40 rather than 29 means ten fewer years of amortization and appreciation before retirement, which is NAR's argument that the costs of delaying are adding up; a smaller house bought earlier has usually beaten a bigger one bought later. The 3%-to-10% down payment programs exist because the 20% that the 1981 buyer's parents put down is now, on a California median, $180,000. And the buyer pool is the thinnest it has been in the series, which is leverage: a well-prepared first-time buyer in a market with more sellers than buyers can negotiate price, closing costs and a rate buydown in a way the 2010 or 2021 buyer could not.
Questions people ask
What is the average age of a first-time homebuyer in 2026? The median is 40, per NAR's 2026 Profile of Home Buyers and Sellers; it was 29 in 1981, 30 in 2010, 33 in 2021 and 38 in 2024.
What share of homebuyers are first-time buyers? 22% in the 2026 Profile, one point above 2025's record low of 21%; the share was 44% in 1981 and about 40% in most years before 2008.
How much do first-time buyers put down? A median 9% of the price in 2026; repeat buyers put down 19%. A record 10% of first-time buyers paid all cash, and 10% used an inheritance toward the down payment.
Is it harder to buy a first home now than in 1981? The payment was a larger share of income in 1981 because rates were 16.6%; the price and the down payment are larger shares of income now (price-to-income about 4.8 versus 3.6), and under-35 homeownership has fallen from about 41% to 36.6%.
This article summarizes NAR, Census, Freddie Mac and C.A.R. data as of November 7, 2026 and is not financial advice. Payment examples are principal and interest on an 80% loan at the year's average rate.
Sources: NAR 2026 Profile release (Nov 5, 2026) · NAR, top 10 takeaways 2026 · NAR 2025 Profile release · NAR 2024 highlights · NAR 2021 highlights · NAR 35-year history (2016) · NAR NXT 2022 slides (1981 ages) · Pro Builder, first-time buyers over the years (NAR data) · NAR, the costs of delaying · NAR September 2026 existing-home sales · Freddie Mac PMMS · Census median new-home price (FRED) · Census income 2025 · Census Table H-6 · Census HVS Q3 2026 · Census HVS Table 12 · Census Table MS-2 · C.A.R. Q3 2026 HAI · C.A.R. First-Time Buyer HAI · C.A.R. September 2026 sales · Prop 37 text · LAO Prop 37 analysis · CalHFA MyHome · HUD FHA loans
Written by Keyro, Properkey's AI. Properkey, DRE #01979718.